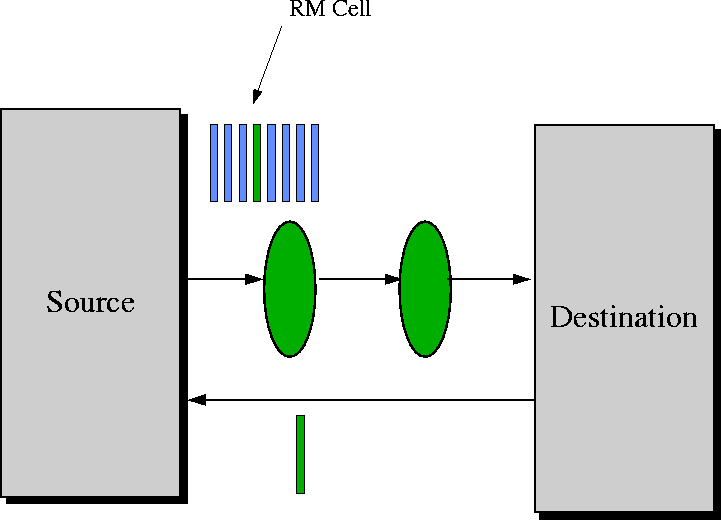
Figure 1
: RM cell path
Raj Jain, Shiv Kalyanaraman, Rohit Goyal, Sonia Fahmy, and Ram Viswanathan
The Ohio State University, Department of CIS, Columbus, OH 43210
Phone: 614-292-3989, Fax: 614-292-2911, Email: Jain@cse.wustl.edu
Abstract
The ERICA switch algorithm has been discussed extensively in TM group in the past. However, over the last two years, the algorithm has been substantially modified. This contribution describes the current version of ERICA switch algorithm in complete detail.
The algorithm achieves both efficiency and fairness, and exhibits a fast transient response. The development of the algorithm is traced, and the new approaches it uses to achieve its objectives are highlighted. Several design and implementation aspects of the algorithm are examined. In addition, several enhancements to the algorithm are proposed and studied.
ATM Forum's Traffic Management Specification TM4.0 specifies in precise details rules for source and destination end-system behavior for available bit rate (ABR) service. However, the switch behavior is only coarsely specified. This provides the flexibility of various vendors implementing their own switch allocation algorithms.
This contribution describes one such switch algorithm. The Explicit Rate Indication for Congestion Avoidance (ERICA) algorithm was presented at the Forum in February 1995. Since then its performance has been independently studied by a number of contributions. A few contributions have also suggested some modifications to the algorithm. We ourselves have been constantly modifying the algorithm. Some of these modifications have been presented earlier but many have not been. This contribution provides a complete description of ERICA as it stands today. During its development, we learnt a lot of lessons in switch algorithm design, we hope that these lessons will help others in testing and designing their own algorithms.
In order to make it a self-sufficient reading, we first briefly explain the ABR service. Then in Section 3.1, we explain the basic ERICA algorithm. Modifications of this basic algorithm are then presented one by one. The pseudocode for the algorithm is presented in Appendix A. A more complete report including extensive simulation results is in preperation and will be available soon on-line our web page: http://www.cse.wustl.edu/~jain/
ATM networks offer five classes of service: constant bit rate (CBR), real-time variable bit rate (rt-VBR), non-real time variable bit rate (nrt-VBR), available bit rate (ABR), and unspecified bit rate (UBR). Of these, ABR and UBR are designed for data traffic, which have a bursty unpredictable behaviour.
UBR service is simple in the sense that users negotiate only their peak cell rates (PCR) when setting up the connection. Then, they can send burst of frames as desired at any time at the peak rate. If too many sources send traffic at the same time, the total traffic at a switch may exceed the output capacity causing delays, buffer overflows, and loss. The network tries to minimize the delay and loss but makes no guarantees.
The ABR service provides better service for data traffic by periodically advising sources about the rate at which they should be transmitting. The switches monitor their load and compute the available bandwidth and divide it fairly among active flows. The feedback from the switches to the sources is sent in Resource Management (RM) cells which are sent periodically by the sources and turned around by the destinations (See Figure 1).

Figure 1
: RM cell path
The RM cells are sent by sources after NRM-1 data cells, where NRM is a parameter with a default value of 32. The RM cells contain the source's current cell rate (CCR) and minimum cell rate (MCR). The RM cells also have several fields that can be used by the switches to provide feedback to the sources. These fields are: Explicit Rate (ER), Congestion Indication (CI) Flag, No Increase (NI) Flag. The ER field indicates the rate that the network can support at the particular instant in time. When starting at the source, the ER field is set to PCR. Also, CI and NI flags are cleared. On the path, each switch reduces the ER field to the maximum rate it can support. In certain cases, it can also set the CI and NI flags. The sources monitor the returning RM cells and adjust their transmission rates as instructed by the ER, CI, and NI fields.
The RM cells flowing from the source to the destination are called Forward RM cells (FRMs) while those returning from the destination to the Source are called backward RM cells (BRMs).
Most VCs are bi-directional in the sense that there is a data flow going from node A to Node B and there is another flow (which can be of different rate) going from Node B to A. Thus, node A acts as a source for one flow and as the destination for another related flow. Similarly, node B acts as a destination for one flow while acting as a source for the other flow. Therefore, there are FRMs that flow from A to B and are turned around by B and become BRMs. There are also FRMs that flow from B to A and are turned around by A and become BRMs.
If a switch or destination becomes extremely congested, it may not want to wait for the next RM cell. They are allowed to generate a limited number of RM cells and send them immediately towards the source. Such RM cells are called ``out-of rate (OOR)'' RM cells. The source generated RM cells are called ``in rate'' RM cells because the bandwidth used by them is counted in the rate allocated to the source. Thus, if a source is allocated 32 cells per second, it can send 31 data cells and one RM cell per second (assuming NRM of 32). The out-of rate and in-rate RM cells are distinguished by a BN (Backward Notification) Flag in the RM cells.
When a source receives a BRM, it computes its allowed cell rate (ACR) using current ACR, CI, NI, BN flags, and the ER field of the RM cell. For a detailed explaination of source and end system behavior, see [ 1].
The ERICA algorithm is concerned with the fair and efficient allocation of the available bandwidth to all contending sources. Like any dynamic resource algorithm, it requires monitoring the available capacity and the current demand on the resources. Here, the key ``resource'' is the available bandwidth at a queueing point (input or output port). In most switches, output buffering is used, which means that most of the queueing happens at the output ports. Thus, ERICA algorithm is applied to each output port (or link).
The pseudo-code for the ERICA algorithm is given in Appendix A. In this section, we present the basic features of the algorithm and explain their operation.
The switch periodically monitors the load on each link and determines a load factor, z, the available capacity, and the number of currently active VCs (N).
The load factor is calculated as the ratio of the measured input rate at the port to the target capacity of the output link.
where,
The Input Rate is measured over an interval called the switch averaging interval. The above steps are executed at the end of the switch averaging interval.
Target utilization (U) is a parameter which is set to a fraction (close to, but less than 100 %) of the available capacity. Typical values of target utilization are 0.9 and 0.95.
The load factor, z, is an indicator of the congestion level of the link. High overload values are undesirable because they indicate excessive congestion; so are low overload values which indicate link underutilization. The optimal operating point is at an overload value equal to one. The goal of the switch is to maintain the network at unit overload.
The fair share of each VC, FairShare, is also computed as follows:
The switch allows each source sending at a rate below the FairShareto rise to FairShareevery time it sends a feedback to the source. If the source does not use all of its FairShare, then the switch fairly allocates the remaining capacity to the sources which can use it. For this purpose, the switch calculates the quantity:
If all VCs changed their rate to their VCSharevalues then, in the next cycle, the switch would experience unit overload (zequals one).
Hence VCShareaims at bringing the system to an efficient operating point, which may not necessarily be fair, and FairShareallocation aims at ensuring fairness, possibly leading to overload (inefficient operation). A combination of these two quantities is used to rapidly reach optimal operation as follows:
Sources are allowed to send at a rate of at least FairSharewithin the first round-trip. This ensures minimum fairness between sources. If the VCSharevalue is greater than the FairSharevalue, the source is allowed to send at VCShare, so that the link is not underutilized. This step also allows an unconstrained source to proceed towards its max-min rate. The previous step is one of the key innovations of the ERICA scheme because it improves fairness at every step, even under overload conditions.
The calculated ER value cannot be greater than the ABR Capacitywhich has been measured earlier. Hence, we have:
Since every output port is a queuing point through which a VC passes, every source ought to send at no more than the ER calculated at its bottleneck queuing point. To ensure that the bottleneck ER reaches the source, each switch computes the minimum of the ER it has calculated as above and the ER value in the RM cell. This value is inserted in the ER field of the RM cell.
A complete flow chart of the algorithm is presented in Figure 2. The flow chart shows steps to be taken on three possible events: at the end of an averaging interval, on receiving a cell (data or RM), and on receving a backward RM cell. These steps have been numbered for reference in further modifications of the basic scheme.
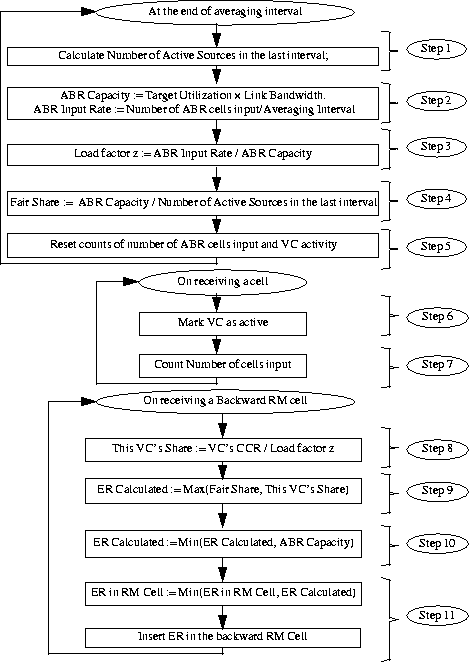
Figure 2
: Flow Chart of the Basic ERICA Algorithm
Assuming that the measurements do not suffer from high variance, the above algorithm is sufficient to converge to efficient operation in all cases and to the max-min fair allocations in most cases. The convergence from transient conditions to the desired operating point is rapid, often taking less than a round trip time.
However, we have discovered cases in which the basic algorithm does not converge to max-min fair allocations. This happens if all of the following three conditions are met:
To achieve max-min fairness, the basic ERICA algorithm is extended by remembering the highest allocation made during one averaging interval and ensuring that all eligible sources can also get this high allocation. To do this, we add a variable MaxAllocPreviouswhich stores the maximum allocation given in the previous interval, and another variable MaxAllocCurrentwhich accumulates the maximum allocation given during the current switch averaging interval. The step 9 of the basic algorithm is replaced by the flow chart shown in Figure 3
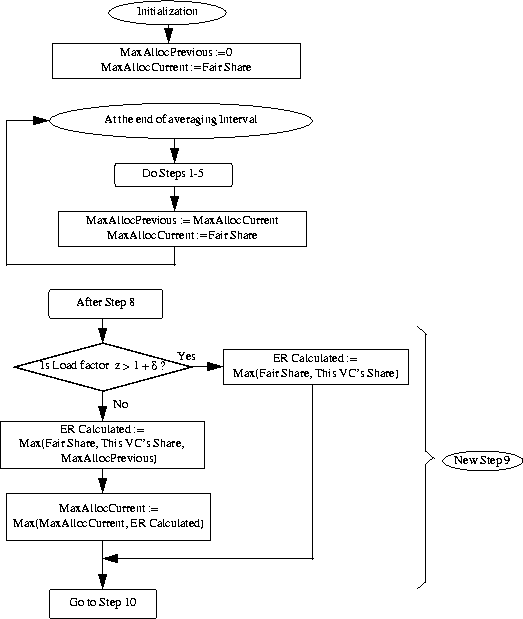
Figure 3
: Flow Chart for Achieving Max-Min Fairness
Basically, for z > 1+δ, where δis a small fraction, we use the basic ERICA algorithm and allocate the source Max (FairShare, VCShare). But, for z <= 1+δ, we attempt to make all the rate allocations equal. We calculate the ER as Max (FairShare, VCShare, MaxAllocPrevious).
The key point is that the VCShareis only used to achieve efficiency. The fairness can be achieved only by giving the contending sources equal rates. Our solution attempts to give the sources equal allocations during underload and then divide the (equal) CCRs by the same zduring the subsequent overload to bring them to their max-min fair shares. The system is considered to be in a state of overload when its load factor, z, is greater than 1+δ. The aim of introducing the quantity δis to force the allocation of equal rates when the overload is fluctuating around unity, thus avoiding unnecessary rate oscillations. The next subsection examines one further modification to the ERICA algorithm.
The inter-RM cell time determines how frequently a source receives feedback. It is also a factor in determining the transient response time when load conditions change. With the basic ERICA scheme, it is possible that a source which receives feedback first can keep getting rate increase indications, purely because it sends more RM cells before competing sources can receive feedback. This results in unnecessary spikes (sudden increases) in rates and queues with the basic ERICA scheme.
The problem arises when the Backward RM (BRM) cells from different sources arrive asynchronously at the switch. Consider a LAN configuration of two sources (A and B), initially sending at low rates. When the BRM arrives, the switch calculates the feedback for the current overload. Without loss of generality, assume that the BRM of source A is encountered before that of source B. Now it is possible that the BRM changes the rate of source A and the new overload due to the higher rate of A is experienced at the switch before the BRM from the source B reaches the switch. The transient overload experienced at the switch may still be below unity, and the ACR of source A is increased further (BRMs for source A are available since source A sends more RM cells at higher rates). This effect is observed as an undesired spike in the ACR graphs and sudden queue spikes when the source B gets its fair share.
This problem can be solved by incorporating the following change to the ERICA algorithm. When the calculated ER is greater than the fair share value, and the source is increasing from a CCR below FairShare, we limit its increase to FairShare. Alternatively, the switch could decide not to give new feedback to this source for one measurement interval. This is useful in LANs where the round trip time is shorter than the inter-RM cell gap and the switch measurement interval. The following computation is added to the switch algorithm.
After ``ER Calculated'' is computed:
IF ( (CCR < FairShare) AND (ER Calculated >= FairShare)) THEN ER Calculated <-- FairShare We can also disable feedback to this source for one measurement interval.
``ER in RM Cell'' is then computed as before.
The original OSU scheme provided its feedback to the RM cells going in the forward direction. This ensured that the CCR in the RM cell was correlated to the load level measured by the switch during that interval. However, the time taken by the forward going RM cell to travel back to the source was long and this slowed down the response of the system.
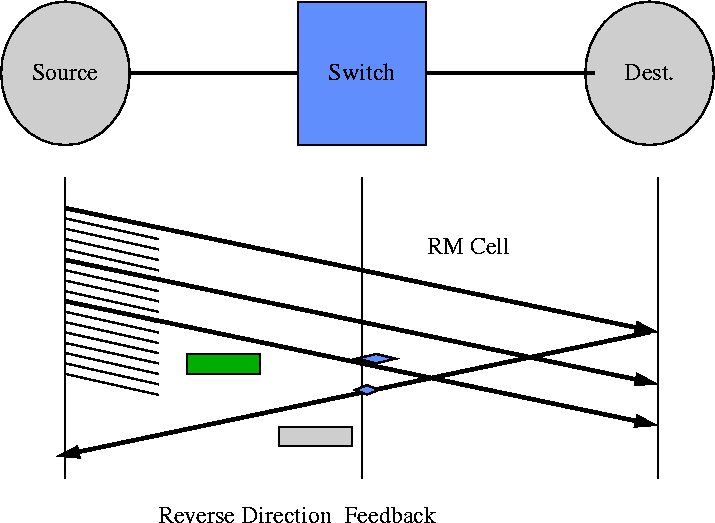
Figure 4
: Reverse Direction Feedback
The only requirement for each switch is to provide its feedback to the sources. This can also be achieved if it indicates the feedback in the reverse path of the RM cell. The backward going RM (BRM) cell takes less time to reach the source than the forward going RM (FRM) cell which has to reach the destination first. Thus, the system responds faster to changes in the load level. However, the CCR carried by the BRM cell no longer reflects the load level in the system. To maintain the most current CCR value, the switch copies the CCR field from FRM cells, and uses this information to compute the ER value to be inserted in the BRM cells. This ensures that the latest CCR information is used in the ER calculation and that the feedback path is as short as possible. Figure 4shows that the first RM cell carries (in its backward path), the feedback calculated from the information in the most recent FRM cell. The CCR table update and read operations still preserve the O(1) time complexity of the algorithm.
The switch measures the overload, the number of active sources and the ABR capacity periodically (at the end of every switch averaging interval). The source also sends RM cells periodically (once every Nrmcells). These RM cells may contain different rates in their CCR fields. If the switch encounters more than one RM cell from the same VC during the same switch interval, then it uses the same value of overload for computing feedback in both cases. For example, if two RM cells from the same VC carried different CCR values, then the feedback in one of them will not accurately reflect the overload. As a result, the switch feedback will be erroneous and may result in unwanted rate oscillations. The switch thus needs to give only one feedback value per VC in a single switch interval.
The above example illustrates a fundamental principle in control theory, which says that the system is unstable when the control is faster than feedback. Further, the system is unresponsive if the control is slower than feedback. Ideally, the control rate should be matched to the feedback rate. In our system, the delay between successive feedbacks should not be greater than the delay between successive measurements (controls).
The original OSU scheme solved the problem of matching the feedback and control rate by correlating the source and switch intervals. The source interval is set to the maximum of all the switch intervals in the path. This ensures that no more than one RM cell from each VC is encountered by any switch during a single switch interval. A disadvantage of this approach is that RM cells can be spaced quite far apart if any switch in the path of the VC has a long interval. As a result, switches with shorter intervals may not see any RM cells for many intervals and would be unable to rapidly provide their feedback to the source. This affects the transient response of the system.
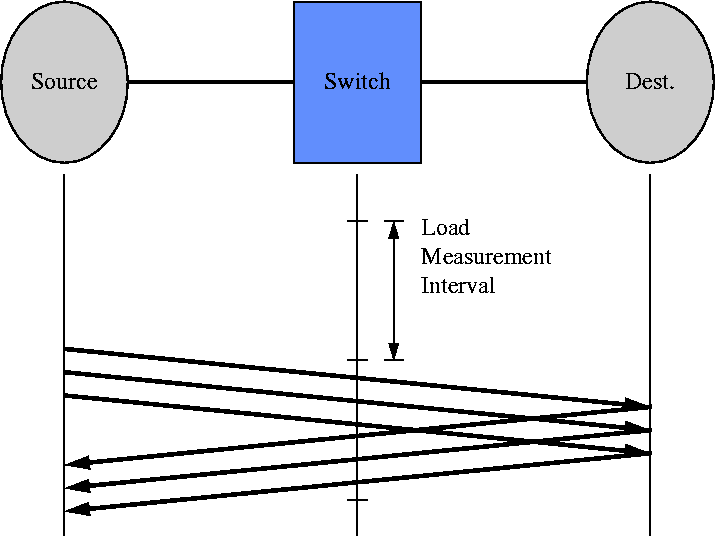
Figure 5
: Independence of source and switch intervals
ERICA adopts a different approach, where the source and the switch intervals need not be correlated. The switch provides only one feedback value during each switch interval irrespective of the number of RM cells it encounters. The switch calculates the ER only once per interval, and the ER value obtained is stored. It inserts the the same ER value in all the RM cells it sees during this interval. The source and switch intervals are completely independent. Furthermore, a switch with a smaller interval can now convey its feedback faster and is not dependent on any other switches in the path. The source independently decides the inter-RM cell distance, thus determining the frequency of feedback. In figure 5, the switch interval is greater than the RM cell distance. The ER calculated in the interval marked Load Measurement Intervalis maintained in a table and set in all the RM cells passing through the switch during the next interval.
The CCR of a source is obtained from the CCR field of the forward going RM cell. The latest CCR value is used in the ERICA computation. It is assumed that the CCR is correlated with the load factor measured. When the CCR is low, the frequency of forward RM cells becomes very low. Hence, the switch may not have a new CCR estimate though a number of averaging intervals have elapsed. Moreover, the CCR value may not be an accurate measure of the rate of the VC if the VC is bottlenecked at the source, and is not able to use its ACR allocation. Note that if a VC is bottlenecked on another link, the CCR is set to the bottleneck allocation within one round-trip. A possible solution to the problems of inaccurate CCR estimates is to measure the CCR of every VC during the same averaging interval as the load factor. This requires the switch to count the number of cells received per VC during every averaging interval and update the estimate as follows:
At the end of an switch averaging interval:
FOR ALL VCs DO CCR[VC] <-- NumberOfCells[VC]/IntervalLength NumberOfCells[VC] <-- 0 ENDWhen a cell is received:NumberOfCells[VC] <-- NumberOfCells[VC] + 1 Initialization:
FOR ALL VCs DO NumberOfCells[VC] <-- 0When an FRM cell is received , do not copy CCR field from FRM into CCR[VC].
Note that using this method, the switch ignores the CCR field of the RM cell. The per-VC CCR computation can have a maximum error of (one cell/averaging interval) in the rate estimate. Hence the error is minimized if the averaging interval is larger.
The effect of the per VC CCR measurement can be explained as follows. The basic ERICA uses the following formula:
The measured CCR estimate is always less than or equal to the estimate obtained from the RM cell CCR field. If the other quantities remain constant, the term ``VCShare'' decreases. Thus the ER calculated will decrease whenever the first term dominates. This change results in a more conservative feedback, and hence shorter queues at the switches.
The discussion so far assumed that the entire link was being shared by ABR sources. Normally, ATM links will be used by constant bit rate (CBR) and variable bit rate (VBR) traffic along with ABR traffic. In fact, CBR and VBR have a higher priority. Only the capacity left unused by VBR and CBR is given out to ABR sources. For such links, we need to measure the CBR and VBR usage along with the input rate. The ABR capacity is then calculated as follows:
The rest of ERICA algorithm remains unchanged. Notice that the target utilization is applied to the entire link bandwidth and not the the left over capacity. That is,
There are two implications of this choice. First, (1-Target Utilization) x (link bandwidth)is available to drain the queues, which is much more that what would be available otherwise. Second, the sum of VBR and CBR usage must be less than (target utilization) x (link bandwidth). Thus, the VBR and CBR allocation should be limited to below the target utilization.
A bursty source sends data in bursts during its active periods, and remains idle during other periods. It is possible that the BRM cell of a bursty source could be traveling in the reverse direction, but no cells of this source are traveling in the forward direction. A possible enhancement to the counting algorithm is to also count a source as active whenever a BRM of this source is encountered in the reverse direction. We refer to this as the ``bidirectional counting of active VCs''.
One problem with this technique is that the reverse queues may be small and the feedback may be given before the FairShareis updated, taking into consideration the existence of the new source. Hence, when feedback is given, we check to see if the source has been counted in the earlier interval and if the FairSharehas been updated based upon the existence of the source. If the source had not been counted, we update the number of active sources and the FairSharebefore giving the feedback. This option is called ``the immediate fairshare update option'' in the flow chart of Figure 6
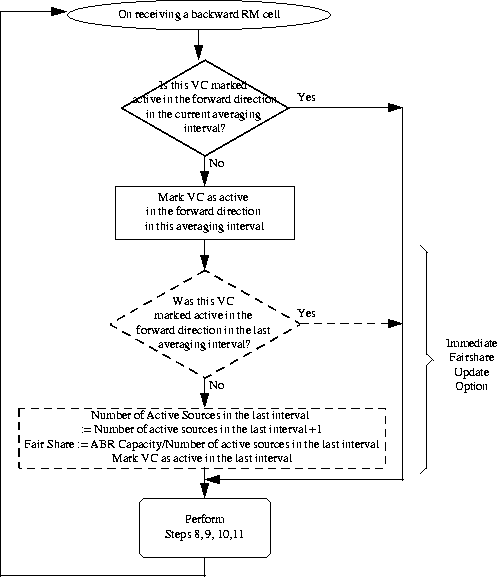
Figure 6
: Flow Chart of Bi-Directional Counting
We could also reset the CCR of such a source to zero after updating the FairSharevalue, so that the source is not allocated more than the FairSharevalue. The motivation behind this strategy is that the source may be idle, but its CCR is unchanged because no new FRMs are encountered. When the per-VC CCR measurement is used, this option is not necessary, because the switch measures the CCRs periodically. The setting of CCR to zero is a conservative strategy which avoids large queues due to bursty or ACR retaining sources. A drawback of this strategy is that in certain configurations, the link may not be fully utilized if the entire traffic is bursty. This is because all the bursty sources are asked to send at FairShare, which may not be the optimal value if some sources are bottlenecked elsewhere. This option can also be enabled and disabled based upon a certain queue threshold.
Another technique to overcome the problem of underestimating the number of active sources is to use exponential averaging to decay the contribution of each VC to the number of active sources count. The main motivation behind this idea is that if a source is inactive during the current interval, but was recently active, it should still contribute to the number of active sources. This is because this source might be sending its data in bursts, and just happened to be idle during the current interval.
Flow charts of Figures 7and 8show this technique.
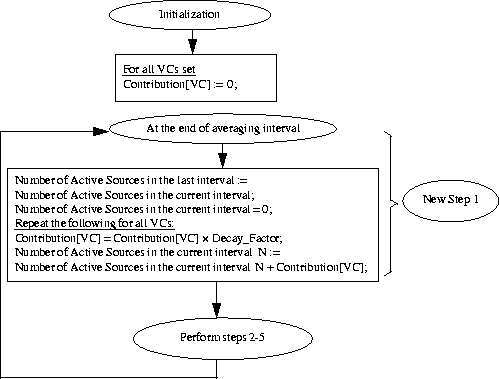
Figure 7
: Flow Chart of averaging number of active sources (part 1 of 2)
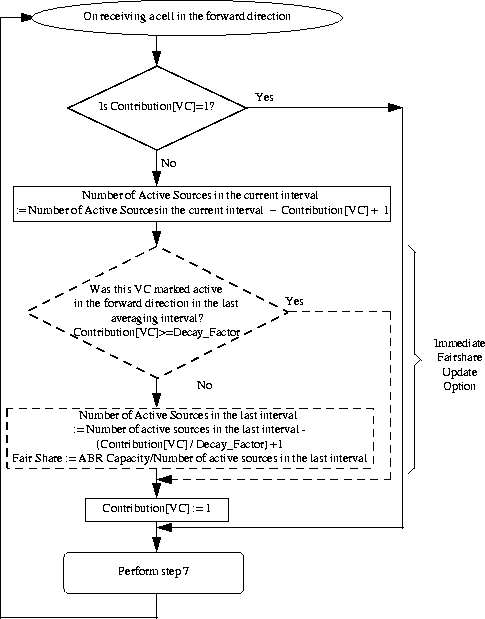
Figure 8
: Flow Chart of averaging number of active sources (part 2 of 2)
The DecayFactorused in decaying the contribution of each VC is a value between zero and one, and is usually selected to be a large fraction, say 0.9. The larger the value of the DecayFactor, the larger the contribution of the sources active in prior intervals, and the less sensitive the scheme is to measurement errors. Setting the DecayFactorto a smaller fraction makes the scheme adapt faster to sources which become idle, but makes the scheme more sensitive to the averaging interval length.
Two boundary conditions are introduced in the calculations at the end of the averaging interval. First, the estimated number of active sources should never be less than one. If the calculated number of sources is less than one, the variable is set to one. Second, the load factor becomes infinity when the ABR capacity is measured to be zero, and the load factor becomes zero when the input rate is measured to be zero. The corresponding allocations are described in Table 1.
| ABR Capacity | Input Rate | Overload | Fairshare | CCR/Overload | Feedback |
|---|---|---|---|---|---|
| Zero | Non-zero | Infinity | Zero | Zero | Zero |
| Non-zero | Zero | Infinity | C/N | Zero | C/N |
| Non-zero | Non-zero | I/C | C/N | CCR*C/I | Max (CCR*C/I, C/N) |
| Zero | Zero | Infinity | Zero | Zero | Zero |
In cases where no input cells are seen in an interval, or when the ABR capacity changes suddenly (possibly due to a VBR source going away), the overload measured in successive intervals may be considerably different. This leads to considerably different feedbacks in successive intervals. An optional enhancement to smoothen this variance is by averaging the load factor. This effectively increases the length of the averaging interval over which the load factor is measured. One way to accomplish this is shown in the flow chart of Figure 9
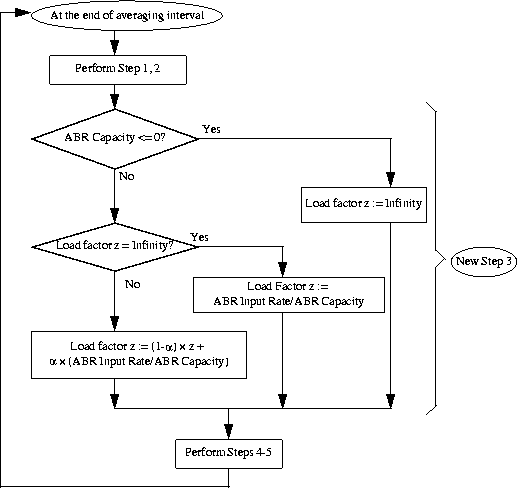
Figure 9
: Flow chart of averaging of load factor (method 1)
The method described above has the following drawbacks. First, the average is reset everytime zbecomes infinity. The entire history accumulated in the average prior to the interval where the load is to be infinity is lost.
For example, suppose the overload is measured in successive intervals as: 2, 1, Infinity, 3, Infinity, 0.5. The method previously described forgets the history in the fourth interval, and restarts at the new value 3. Similarly in the sixth interval, it restarts at the value 0.5. Note that this introduces dependencies between the boundary cases and the average value of the load factor.
The second problem with this method is that the exponential average does not give a good indication of the average value of quantities which are not additive. In our case, the load factor is not an additive quantity. However, the number of ABR cells received or output is additive.
Observe that the load factor is a ratio of the input rate and the ABR capacity. The correct way to average a ratio is to find the ratio of the average (or the sum) of the numerators and divide it by the average (or the sum) of the denominators. That is, the average of x1/y1, x2/y2, ... , xn/yn is (x1+x2+ ... +xn)/(y1+y2+ ... + yn).
To average load factor, we need to average the input rate (numerator) and the ABR capacity (denominator) separately. However, the input rate and the ABR capacity are themselves ratios of cells over time. The input rate is the ratio of number of cells input and the averaging interval. If the input rates are x1/T1, x2/T2, ... , xn/Tn, the average input rate is ((x1 + x2 + ... + xn)/n)/((T1 + T2 + ... + Tn)/n). Here, xi's are the number of ABR cells input in averaging interval i of length Ti. Similarly the average ABR capacity is ((y1 + y2 + ... + yn)/n)/((T1 + T2 + ... + Tn)/n). Here, yi's are the maximum number of ABR cells that can be output in averaging interval i of length Ti.
The load factor is the ratio of these two averages. Observe that each of the quantities added is not a ratio, but a number.
Exponential averaging is an extension of arithmetic averaging used above. Hence, the averages like (x1 + x2 + .... xn)/n can be replaced by the exponential average of the variable xi.
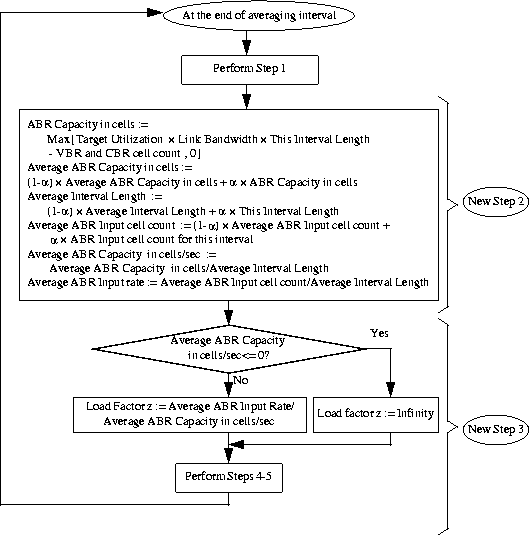
Figure 10
: Flow chart of averaging of load factor (method 2)
The flow chart of Figure 10describes this averaging method.
Observe that the load factor thus calculated is never zero or infinity unless the input rate or ABR capacity are always zero. If the input rate or the ABR capacity is measured to be zero in any particular interval, the boundary cases for overload are not invoked. The load level increases or decreases to finite values.
The load factor, available ABR capacity and the number of active sources need to be measured periodically. There is a need for an interval at the end of which the switch renews these quantities for each output port. The length of this interval determines the accuracy and the variance of the measured quantities. As mentioned before, longer intervals provide lower variance but result in slower updating of information. Alternatively, shorter intervals allow fast response but introduce greater variance in the response. This section proposes alternative intervals for averaging the quantities.
The averaging interval can be set as the time required to receive a fixed number of ABR cells (M) at the switch in the forward direction. While this definition is sufficient to correctly measure the load factor and the ABR capacity at the switch, it is not sufficient to measure the number of active VCs (N) or the CCR per VC accurately. This is because the quantities N and CCR depend upon the fact that at least one cell from the VC is encountered in the averaging interval. Moreover, when the rates are low, the time to receive M cells may be large. Hence the feedback in the reverse direction may be delayed.
An alternative way of averaging the quantities is by a fixed time interval, T. This ensures that any source sending at a rate greater than (one cell/T) will be encountered in the averaging interval. This interval is independent of the number of sources, but is dependent upon the minimum rate of the source. In addition to this, if the aggregate input rate is low, the fixed-time interval is smaller than the fixed-cells interval. However, when there is an overload, the fixed-cells interval provides faster response.
One way of combining these two kinds of intervals is to use the minimum of the fixed-cell interval and the fixed-time interval. This combination ensures quick response for both overload and underload conditions. But it still suffers from the disadvantages of a fixed-cell interval, where N and per-VC CCR cannot be measured accurately.
Another strategy for overcoming this limitation is to measure N and per-VC CCR over a fixed-time interval, and the capacity and load factor over the minimum of the fixed-cell and fixed-time interval. The time intervals can be different as long as some correlation exists between the quantities measured over the different intervals. Typically, the intervals to measure CCR and N would be larger to get more stable estimates.
A limitation of this strategy is that a sudden increase in the number of sources, N, or the measured CCRs cannot be sensed quickly. If we aim at allocating rates conservatively, the increase in CCRs does not pose a problem because we will use a smaller value of CCR in the ERICA formula, and give a smaller rate allocation. Rate increase will occur as soon as the fixed-time averaging interval yields a new value. However, the sudden increase in number of active sources (N) is of concern, since the allocation is inversely proportional to N. A smaller N may result in a larger allocation to all the sources and subsequent overload until the new value of N is calculated.
Most congestion control schemes provide the network administrator with a number of parameters that can be set to adapt the behavior of the schemes to their needs. A good scheme must provide a small number of parameters that offer the desired level of control. These parameters should be relatively insensitive to minor changes in network characteristics.
ERICA provides a few parameters which are easy to set because the tradeoffs between their values are well understood. Our simulation results have shown that slight mistuning of parameters does not significantly degrade the performance of the scheme. Two parameters are provided: the Target Utilization (U) and the Switch Measurement Interval.
The Target Utilization determines the link utilization during steady state conditions. If the input rate is greater than Target Utilization x Link Capacity, then the switch asks sources to decrease their rates to bring the total input rate to the desired fraction. If queues are present in the switch due to transient overloads, then (1 - U) x Link Capacityis used to drain the queues. The network administrator is free to set the values of Target Utilization as desired.
Excessively high values of Target Utilization are undesirable because they lead to long queues and packet loss, while low Target Utilization values lead to link underutilization. The effectiveness of the value of Target Utilization depends on the feedback delay of the network. Transient overloads can potentially result in longer queues for networks with longer feedback delays. Due to this, smaller Target Utilization values are more desirable for networks with long propagation delays.
Our simulation results have determined that ideal values of Target Utilization are 0.95 and 0.9 for LANs and WANs respectively. Smaller values improve the performance of the scheme when the traffic is expected to be highly bursty.
The Switch Measurement Interval determines the accuracy of feedback. This interval is used to measure the load level, link capacity and the number of active VCs for an outgoing link. The length of the measurement interval establishes a tradeoff between accuracy and steady state performance. This tradeoff has been briefly discussed in section 3.5.
ERICA measures the required quantities over an averaging interval and uses the measured quantities to calculate the feedback in the next averaging interval. Averaging helps smooth out the variance in the measurements. However, the length of the averaging interval limits the amount of variance which can be eliminated. It also determines how quickly the feedback can be given to the sources, because ERICA gives at most one feedback per source per averaging interval. Longer intervals produce better averages, but slow down the rate of feedback. Shorter intervals may result in more variance in measurements, and may consistently underestimate the measured quantities.
The load factor and available capacity are random variables whose variance depends on the length of the averaging interval. In practice, the interval required to measure the number of active sources is sufficient for the measurement of the load factor and available capacity. Both of these averaged quantities are fairly accurate, with an error margin of (one cell/averaging interval). Setting the target utilization below 100% helps drain queues due to errors in measurement of all the quantities. Whenever the scheme faces tradeoffs due to high errors in measurement, the degree of freedom is to reduce the target utilization parameter, sacrificing some steady state utilization for convergence.
Since the switches provide multiple classes of service, they maintain multiple queues. The key question is how cells in these different queues are serviced. In this section, we describe a scheduling policy which allows the implementor (or user) to allocate "soft" percentages of link capacity for various classes. These allocations are soft in the sense that if one class does not use its allocation, it is automatically passed on to the other class(es).
For example, in the case of a simple two class (VBR and ABR) system, an implementor could decide to give VBR a maximum of 90% and ABR a minimum of 10% bandwidth. If total VBR load is only 20%, ABR gets the remaining 80%. On the other hand if VBR input rate is 110% and ABR input rate is 15%, VBR gets only 90% and ABR gets 10%. If VBR and ABR are 110% and 5%, VBR gets 95% and ABR gets 5%.
Consider the two categories ABR and VBR. The VBR service class is characterized by PCR and SCR parameters which the network must provide to the VBR class. The ABR service class on the other hand is characterized by MCR. The network only guarantees a minimum bandwidth of MCR to the ABR class. Any other available bandwidth is also allocated to this class. Since VBR applications are delay sensitive while ABR applications are not, VBR can be considered to be a higher priority class than ABR.
Let vfracand afracbe the fractions of the total link capacity allocated to VBR and ABR respectively. If VBR and ABR are the only two supported service categories, then we can assume without loss of generality that
At any cell time, a scheduler that supports these two classes decides which class is eligible to be serviced so as to provide at least vfracto VBR and at least afracto ABR. Ties are broken in favor of VBR since it has higher priority. The fractions are parameters to the scheduling policy. The fairness criteria translates to meeting the minimum bandwidth requirements of ABR and at the same time giving a higher priority to VBR. If both classes have cells to send at all times, then for every ncells (for large enough n), n*afracABR cells and n*vfracVBR cells must be scheduled. If at any particular scheduling timeslot, either VBR or ABR is unable to use its chance, (indicated by zero queue length for that class) then the unused timeslot must be allocated to the other class.
The scheduling is implemented by a credit policy described below. The scheduler keeps track of the relative proportions of bandwidth currently used by each class by maintaining credit variables acreditand vcredit. At each time slot, the following operations are performed:
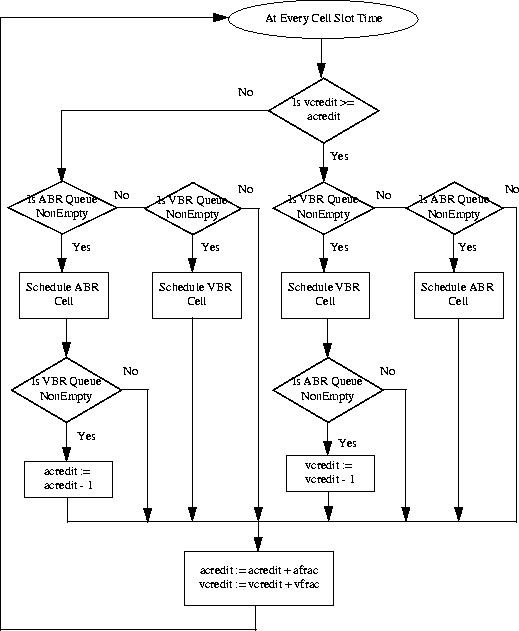
Figure 11
: Flow chart of 2-class scheduling
ERICA+ is a further modification of ERICA. In this section, we describe the goals, target operating point, the algorithm, and parameter setting for ERICA+.
ERICA depends upon the measurement of metrics like the overload factor, and the number of active ABR sources. If there is a high error in the measurement, and the target utilization is set to very high values, ERICA may diverge, i.e., the queues may become unbounded, and the capacity allocated to drain the queues becomes insufficient. The solution, under such cases is to set the target utilization to a smaller value, allowing more bandwidth to drain queues. However, steady state utilization (utilization when there is no overload) is reduced because it depends upon the target utilization parameter.
One simple enhancement to ERICA is to have a queue threshold, and reduce the target utilization if the queue is greater than the threshold. Once the target utilization is low, the queues are drained out quickly. Hence, this enhancement maintains high utilization when the queues are small, and drains out queues quickly when they become large. Essentially, we are using the queue length as a secondary metric (input rate is the primary metric).
In our OSU scheme and ERICA work, we have not considered the queue length or queue delay as a possible metric. In fact, we rejected it, saying that it gives no indication of the correct rates of the sources. In ERICA+, we maintain that the correct rate assignments depend upon the aggregate input rate, rather than the queue length.
However, we recognize two facts about queues: a) non-zero queues imply 100% utilization, and, b) a system with very long queues is far away from intended operating point. Hence in ERICA+, if the input rates are low and the queues are long, we recognize the need to reserve more capacity to drain the queues and allocate rates conservatively till the queues are under control. Further, keeping in line with the design principles of OSU scheme and ERICA, we use continous functions of the queue length, rather than discontinuous functions. Since feedback to sources is likely to be regular (as long as queues last), the allocations due to a continuous function, in successive averaging intervals track the behavior of the queue, and reflect it in the rate allocations.
ERICA achieves high utilization in the steady state, but utilization is limited by the target utilization parameter. For expensive links, it is desirable to keep the steady state utilization at 100%. This is because a link being able to service 5% more cells can translate into 5% more revenue. The way to get 100% utilization in steady state, and quick draining of queues is to vary the target ABR rate dynamically. During steady state target ABR rate is 100% while it is lower during transient overloads. Higher overloads result in even lower target rates (thereby draining the queues faster). In other words:
Target Rate = fn (queue length, link rate, VBR rate)
The ``fn'' above has to be a decreasing function of queue length.
Note that ERICA has a fixed target utilization, which means that the drain rate is independent of the queue size.
One feature of ABR is that its capacity varies dynamically, due to the presence of higher priority classes(CBR and VBR). Hence, if the higher priority classes are absent for a short interval (which may be smaller than the feedback delay), the remaining capacity is not utilized. In such situations, it useful to have a ``pocket'' full of ABR cells which use the available capacity while the RM cells are taking the ``good news'' to the sources and asking them to increase their rates.
One way to achieve this effect is to control the queues to a ``target queue length.'' In the steady state, the link is 100% utilized, and the queue length is equal to the target queue length, which is the ``pocket'' of queues we desire. If the queue length falls below this value, the sources are encouraged to increase their rate and vice versa. In other words:
Target rate = fn (queue length, target queue length, Link rate, VBR rate)
The above function is not scalable to various link speeds because, queue length measured in cells translates to different drain times for different transmission speeds. For example, a queue length of 5 at a T1 link may be considered large while a queue length of 50 at an OC-3 link may be considered small. This point is significant due to varying nature of ABR capacity, especially in the presence of VBR sources.
To achieve scalability, we need to measure all queue lengths in units of time rather than cells. However, the queue is only directly measurable quantity at the switch. The queueing delay is then estimated using the measured ABR capacity value. Hence the above function for target rate becomes:
Target Rate = fn (queue delay, target queue delay, Link Rate, VBR Rate)
In the following sections, we define and describe a sample function to calculate the target rate.
ERICA+ uses a new target operating point, as shown in Figure 12. The new target operating point has 100% utilization and a fixed non-zero queueing delay. This point differs from the kneepoint (congestion avoidance: 100% throughput, minimum delay) in that it has a fixed non-zero delay goal. This is due to non-zero queueing delay at the operating point. Note that the utilization remains 100% as long as the queue is non-zero. The utilization remains at 100% even if there are short transient underloads in the input load, or the output capacity increases (appearing as an underload in the input load).
We note that, non-zero queue values in steady state implies that the system is in an unstable equilibrium. Queues grow immediately during transient overloads. In contrast, the ERICA and OSU schemes could allow a small load increases (5 to 10%) without queue length increases.
The challenge of ERICA+ is to maintain the unstable equilibrium of non-zero queues and 100% utilization. Specifically, when the queueing delay drops below the target value, T0, ERICA+ increases allocation of VCs to reach the optimum delay. Similarly, when the queueing delay increases beyond T0, the allocation to VCs is reduced and the additional capacity is used for queue drain in the next cycle. When the queueing delay is T0, 100% of the ABR capacity is allocated to the VCs.
ERICA+ hence, introduces a new parameter, T0in place of the target utilization parameter of ERICA.
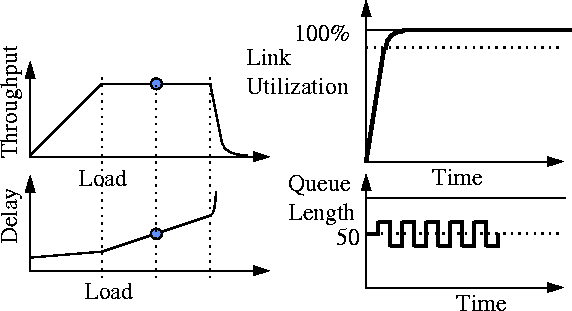
Figure 12
: Operating point of ERICA+
As mentioned before, the ERICA+ scheme is a modification of the ERICA scheme. In addition to the suggested scheduling method between VBR and ABR classes, the following are the changes to ERICA.
This function must satisfy the following constraints:
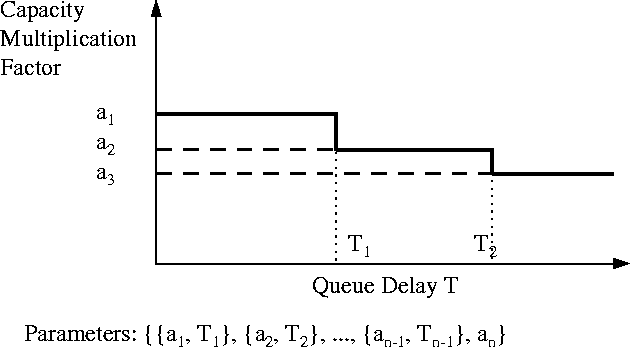
Figure 13
: Step functions for Queue Control
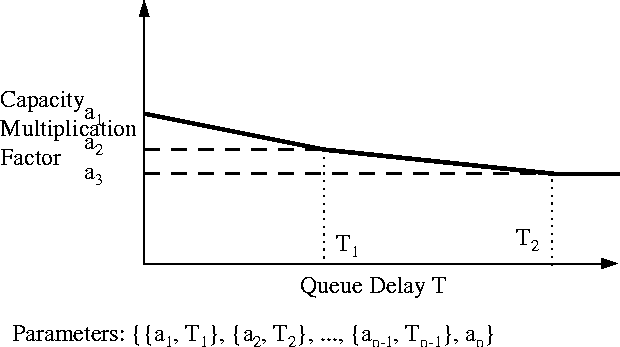
Figure 14
: Linear functions for Queue Control
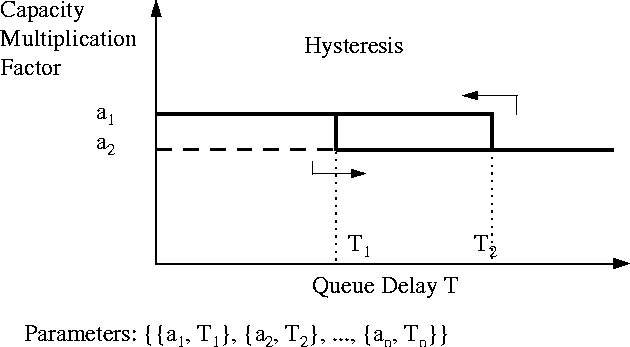
Figure 15
: Hysterisis functions for Queue Control
A step function which reduces the capacity in steps (down to the cutoff value) as the queueing delay exceeds thresholds is a possible choice. This is shown in Figure 13. Linear segments as shown in figure 14can be used in place of step functions. Hysterisis thresholds (figure 15) can be used in place of using a single threshold to increase and decrease the capacity. Hysterisis implies that we use one threshold to increase the capacity and another to decrease the capacity. However, these functions require the use of multiple thresholds (multiple parameters). Further, the thresholds are points of discontinuity, i.e., the feedback given to the source will be very different if the system is on the opposite sides of the threshold. Since queueing delay is a highly variant quantity, the thresholds and experience is required to choose these different parameters.
However, it is possible to have a function with just 2 parameters, one for the two ranges: (0, Q0) and (Q0, inf) respectively. The rectangular hyperbolic and the negative exponential functions are good choices to provide the aggressive control required when the queues grow. We choose the former which is the simpler of the two.
Since the portion T < T0requires milder control, we can have a different hyperbola for that region. This requires an extra parameter for this region.
The queue control scheme uses a time (queueing delay) as a threshold value. Hence, depending upon the available capacity at the moment, this value T0translates into a queue length Q0, as follows :
In the following discussion, we will refer to Q0 and queues alone, but Q0 is a variable dependent upon available capacity. The fixed parameter is T0. The queue control function, as shown in Figure 16, is :
and
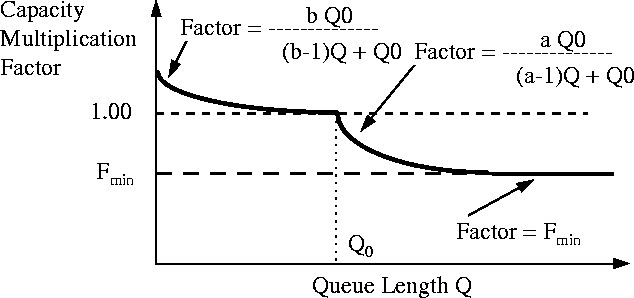
Figure 16
: The Queue Control Function in ERICA+
Note that f(T_{q})is a number between 1 and 0 in the range Q0 to infinity and between b and 1 in the range 0 to Q0. Both curves intersect at Q0, where the value is 1. These are simple rectangular hyperbolas which assume a value 1 at Q0.
This function is lower bounded by the queue drain limit factor (QDLF):
ERICA+ calculates the target ABR capacity, which is the product of f(T_{q})and the ABR capacity. Now, both these quantities are variant quantities (random variables), and the product of two random variables (say, A and B) results in a random variable (say, C) which has more variance either A or B. Feedback becomes less reliable as the variance increases.
For example, overload depends upon the ABR Capacity and is used in the formula to achieve max-min fairness. Since the ERICA+ algorithm changes the ABR Capacity depending upon the queue lengths, this formula needs to tolerate minor changes in load factor. In fact, the formula applies hysterisis to eliminate the variance due to load factor. Since, techniques like hysterisis and averaging can tolerate only a small amount of variance, we need understand and reduce the variance in the target ABR capacity. We examine the ABR capacity term first. ABR capacity is estimated over the averaging interval of ERICA. A simple estimation process is to count the VBR cells sent, calculate the VBR capacity, and subtract it from the link capacity. This process may have an error of one VBR cell divided by the averaging interval length. The error can be minimized by choosing longer averaging intervals.
We note, however, that measured ABR capacity has less variance than instantaneous queue lengths. This follows because, averages of samples have less variance than the samples themselves, and ABR capacity is averaged over an interval, whereas queue length is not. Note that, Hence, the quantity Q0 = T0 x ABR Capacityhas the same variance as that of the measured ABR capacity.
We now examine the function, f(T_{q}). This function is bounded below by QDLFand above by b. Hence, its values lie in the range (QDLF,b) or in practice, in the range, (0.5, 1.05). Further, it has variance because it depends upon the queue length, qand the quantity Q0. Since the function includes a ratio of Q0and q, it has higher variance than both quantities.
One way to reduce the variance is to use an averaged value of queue length (q), instead of the instantaneous queue length. A simple average is the mean of the queue lengths at the beginning and the end of a measurement interval. This is sufficient for small averaging intervals. If the averaging interval is long, a better average can be obtained by sampling the queue lengths during the interval and taking the average of the samples. Sampling of queues can be done in the background.
Another way to reduce variance is specify a constant Q0. This can be specified instead of specifying T0if a target delay in the range of
%TALK ABOUT THE EFFECT OF VARIANCE IN CAPACITY ON ERICA PARTS
The queue control function in ERICA+ has four parameters: T0, a, b, and QDLF. In this section, we explain how to choose values for the parameters and discuss techniques to reduce variance in the output of the function.
The function f(T_{q})has three segments: a hyperbola characterized by the parameter b(called in the b-hyperbola henceforth) between queueing delay of zero and T0, a a-hyperbola from a queueing delay of T0till f(T_{q})equals QDLF, and QDLFhenceforth. Hence, the range of the function f(T_{q})is [QDLF,b].
Note that aand bare the intercepts of the a-hyperbola and b-hyperbola, i.e., the value of f(T_{q})when q = 0. bdetermines how much excess capacity would be allocated when the queueing delay is zero. aand balso determine the slope of the hyperbola, or, in other words, the rate at which f(T_{q})drops as a function of queueing delay. Larger values of aand bmake the scheme very sensitive to the queueing delay, whereas, smaller values increase the time required to reach the desired operating point.
The parameter bis typically smaller than a. bdetermines the amount of overallocation required to reach the target delay T0quickly in the steady state. Any small overallocation above 100% of ABR capacity is sufficient for this purpose. The parameter aprimarily determines how quickly the function f(T_{q})drops as a function of queueing delay. ashould not be very different from bbecause, this can result in widely different allocations when the delay slightly differs from T0. At the same time, ashould be high enough control the queues quickly.
Through simulation, we find that the values 1.15 and 1.05 for aand brespectively work well for all the workloads we have experimented with. Hence, at zero queues, we overallocate upto 5% excess capacity to get the queues upto Q0. Higher values of bwould allow sources to overload to a higher extent. This can aggravate transient overloads and result in higher queue spikes. Using a value of 1 for bis also acceptable, but the ``pocket'' of queues builds up very slowly in this case. Further, these parameters values for aand bare relatively independent of T0or QDLF. Given these values for aand b, the function depends primarily on the choice of T0and QDLFas discussed below.
When the function is f(T_{q})one of the two hyperbolas, its slope (df / dq) is inversely proportional to the parameter T0. For a constant value of a, larger T0reduces the slope of the function, and hence its effectiveness. The queueing delay required to reduce the ABR capacity by a fixed fraction is directly proportional to T0. It is also directly proportional to the ABR capacity. Hence, if the ABR capacity is high (as is the case in OC-3 and higher speed networks), the queues need to build up to a large value before the drain capacity is sufficient. Hence, the maximum value of T0depends upon and how fast the transient queues need to be cleared.
The maximum value of T0also depends on the buffer size at the switch, and must be set to allow the control of the queues before the buffer limit is reached. One strategy is to keep the buffer size at least the sum of the feedback delay and 8*T0(assuming a = 1.15 and QDLF= 0.5, and ABR capacity is constant, and other factors like measurement interval length are negligible). One feedback delay is enough for the feedback to reach the sources and 8*T0is enough for the function to reach QDLF. For other values of QDLF, the recommended buffer size is
A minimum value of T0is also desired for stable operation. If T0is very small, the function f(T_{q})can traverse the range [QDLF,b]in a time (a - QDLF)*T0 / [(a-1)*QDLF], assuming that capacity is constant over this period of time. This time can be shorter than the feedback delay, and lead to undesired oscillations in rates and queues. This is because the function changes from bto QDLFbefore feedback is effective. Such a behavior is undesired because, the scheme now is very sensitive to the changes in queue length. Recall that queue length is only a secondary metric, i.e., we want the input rate and not the queue length to be the primary metric of congestion. Further, the minimum T0is the at least the ``pocket'' of queues desired. For WANs, T0is at least [(a-1)*QDLF] / (a - QDLF)of the feedback delay, which is 1/8, assuming a= 1.15, QDLF= 0.5. For LANs we set T0at least to one feedback delay, to reduce the sensitivity of the ABR capacity on small queue lengths.
QDLFensures that there is enough drain capacity to drain out the transient queues. We recommend a value of 0.5 for WAN switches and 0.8 for LAN switches.
WAN switches need to have greater drain capacity because of the longer feedback delays of its VCs and consequently longer response times to transient overloads. If the fluctuations in load or capacity are of a time-scale much smaller than the feedback delay, the rate allocations using a high target rate may not be sufficient. Transient queues may build up in such cases unless there is sufficient capacity allocated to drain the queues. An example of such high variance workload is TCP traffic combined with a VBR load which has an ON-OFF period of 1ms, whereas the feedback delay is 10ms.
However, for LAN switches which can receive feedback rapidly, and T0is small, the function can move quickly through the range [QDLF,b]. Given these conditions, a large drain capacity is not required, since large queues never build up. For such configurations, QDLFcan have higher values like 0.8.
Since the QDLFparameter defines the lower bound of the function f(T_{q}), we should ensure that this value is reached only for large queue values. This can be achieved by choosing small values for a, or large values for T0. Since large values of T0reduce the effectiveness of the function f(T_{q}), the parameter ais chosen small. This is another factor in the choice of a. It turns out that the recommended value 1.15 is small enough for the QDLFvalues recommended.
This contribution has described a congestion avoidance scheme for data traffic in ATM networks. The scheme achieves both efficiency and fairness, and exhibits a fast transient response. The development of the scheme was traced, and the new approaches it uses to achieve its objectives were highlighted. Several design and implementation aspects of the scheme were examined examined and its performance was discussed. In addition, several enhancements to the scheme were proposed and studied.
A patent application has been filed for ERICA and ERICA+ [ 35, 36}.
We use the following identifying names of flow charts:
Explanation of some of the variables used:
| Name | Explanation | Flow Chart/Figure |
|---|---|---|
| ABR_Cell_Count | Number of ABR input | Flow charts 1 and 7 |
| cells in the current interval | (step 2) | |
| Contribution[VC] | Contribution of the VC | Flow charts 4 and 5 |
| towards the count of the | ||
| number of active sources | ||
| Seen_VC_In_This_Interval[VC] | A bit which is set | Flow charts 1,3 and 5 |
| Seen_VC_In_Last_Interval[VC] | when a VC is seen in | |
| the current (last) interval | ||
| Number_Of_Cells[VC] | Used in Per VC CCR option | |
| to count number of cells | ||
| from each VC in the current | ||
| interval | ||
| Max_Alloc_Previous | Max rate allocation | Flow chart 2 |
| in previous interval | ||
| Max_Alloc_Current | Max rate allocation | Flow chart 2 |
| in current interval | ||
| VBR_Credit | Credit variables | Flow chart 8 |
| ABR_Credit | used in scheduling | |
| Seen_BRM_Cell_In_This_Interval[VC] | A BRM from the source | Figure 5 |
| has been seen (and feedback | ||
| given) in this interval. | ||
| Do not give new feedback | ||
| Last_Allocated_ER | Unique ER feedback to the | Figure 5 |
| source in the current interval | ||
| Decay_Factor | Factor Used in Averaging | Flow Charts 4 and 5 |
| the Number of Active Sources | ||
| 0 <= Decay_Factor <= 1 |
Initialization:
(* ABR Capacity and Target Utilization *) IF (Queue_Control_Option) THEN Target_Utilization <-- 1 END (* IF *) ABR_Capacity_In_cps <-- Target_UtilizationxLink_Bandwidth - VBR_and_CBR_Capacity (* Count of Number of VCs, Cells *) FOR ALL VCs DO Contribution[VC] <-- 0 Seen_VC_In_This_Interval[VC] <-- 0 Seen_BRM_Cell_In_This_Interval[VC] <-- 0 END (* FOR *) ABR_Cell_Count <-- ABR_Capacity_In_cps xAveraging_Interval Number_Active_VCs_In_This_Interval <-- Total Number of Setup VCs Number_Active_VCs_In_Last_Interval <-- Number_Active_VCs_In_This_Interval (* Fairshare and Load Factor variables *) Fair_Share <-- ABR_Capacity_In_cps / Number_Active_VCs_In_Last_Interval Max_Alloc_Previous <-- 0 Max_Alloc_Current <-- Fair_Share Load_Factor <-- ABR_Capacity_In_cps/ FairShare (* Per VC CCR Option Variables *) IF (Per_VC_CCR_Option) THEN FOR ALL VCs DO Number_Of_Cells[VC] <-- 0 END (* FOR *) END (* IF *) (* 2-class Scheduling variables *) VBR_Fraction, ABR_Fraction <-- preassigned bandwidth fractions VBR_Credit <-- VBR_Fraction ABR_Credit <-- ABR_FractionA cell of ``VC'' is received in the forward direction:
IF (Averaging_VCs_Option) THEN IF (Contribution[VC] < 1) THEN (* VC inactive in current interval *) Number_Active_VCs_In_This_Interval <-- Number_Active_VCs_In_This_Interval - Contribution[VC] + 1 IF ((Immediate_Fairshare_Update_Option) AND (Contribution[VC] < Decay_Factor)) THEN Number_Active_VCs_In_Last_Interval <-- Number_Active_VCs_In_Last_Interval - (Contribution[VC] / Decay_Factor) + 1 Fair_Share <-- ABR_Capacity_In_cps / Number_Active_VCs_In_Last_Interval END (* IF *) Contribution[VC] <-- 1 END (* IF *) ELSE IF (NOT(Seen_VC_In_This_Interval[VC])) THEN Seen_VC_In_This_Interval[VC] <-- 1 END (* IF *) IF ((Immediate_Fair_Share_Option) AND (NOT(Seen_VC_In_Last_Interval[VC]))) THEN Number_Active_VCs_In_Last_Interval <-- Number_Active_VCs_In_Last_Interval + 1 Fair_Share <-- ABR_Capacity_In_cps / Number_Active_VCs_In_Last_Interval Seen_VC_In_Last_Interval[VC] <-- 1 END (* IF *) END (* IF *) ABR_Cell_Count <-- ABR_Cell_Count + 1 IF (Per_VC_CCR_Option) THEN Number_Of_Cells[VC] <-- Number_Of_Cells[VC] + 1 END (* IF *)Averaging interval timer expires:
IF (NOT(Averaging_VCs_Option)) THEN Number_Active_VCs_In_Last_Interval <-- Max (Sum(Seen_VC_In_This_Interval), 1) Number_Active_VCs_In_This_Interval <-- 0 FOR ALL VCs DO Seen_VC_In_Last_Interval[VC] <-- Seen_VC_In_This_Interval[VC] END (* FOR *) ELSE Number_Active_VCs_In_Last_Interval <-- Max(Number_Active_VCs_In_This_Interval,1) Number_Active_VCs_In_This_Interval <-- 0 FOR ALL VCs DO Contribution[VC] <-- Contribution[VC] x Decay_Factor Number_Active_VCs_In_This_Interval <-- Number_Active_VCs_In_This_Interval + Contribution[VC] END (* FOR *) END (* IF *) IF (Exponential_Averaging_Of_Load_Method_2_Option) THEN ABR_Capacity_In_Cells <-- Max(Target_UtilizationxLink_Bandwidthx Averaging_Interval - VBR_and_CBR_Cell_Count, 0) Avg_ABR_Capacity_In_Cells <-- (1-α)x Avg_ABR_Capacity_In_Cells + α x ABR_Capacity_In_Cells Avg_Averaging_Interval <-- (1-α)x Avg_Averaging_Interval + α xAveraging_Interval Avg_ABR_Cell_Count <-- (1-α)xAvg_ABR_Cell_Count + α xABR_Cell_Count ABR_Input_Rate <-- Avg_ABR_Cell_Count / Avg_Averaging_Interval ABR_Capacity_In_cps <-- Avg_ABR_Capacity_In_Cells / Avg_Averaging_Interval ELSE VBR_and_CBR_Cell_Rate <-- VBR_and_CBR_Cell_Count / Averaging_Interval ABR_Capacity_In_cps <-- Max(Target_UtilizationxLink_Bandwidth - VBR_and_CBR_Cell_Rate, 0) ABR_Input_Rate <-- ABR_Cell_Count / Averaging_Interval END (* IF *) IF (Queue_Control_Option) THEN Target_Queue_Length <-- Target_Time_To_Empty_Queue x ABR_Capacity_In_cps Queue_Control_Factor <-- Fn(Current_Queue_Length) ABR_Capacity_In_cps <-- Queue_Control_Factor x ABR_Capacity_In_cps END (* IF *) IF (Exponential_Averaging_Of_Load_Method_1_Option) THEN IF (ABR_Capacity_In_cps <= 0) THEN Load_Factor <-- Infinity ELSE IF (Load_Factor = Infinity) THEN Load_Factor <-- ABR_Input_Rate / ABR_Capacity_In_cps ELSE Load_Factor <-- (1-α) x Load_Factor + α x ABR_Input_Rate / ABR_Capacity_In_cps END (* IF *) END (* IF *) ELSE IF (Exponential_Averaging_Of_Load_Method_2_Option) THEN IF (ABR_Capacity_In_cps <= 0) THEN Load_Factor <-- Infinity ELSE Load_Factor <-- ABR_Input_Rate / ABR_Capacity_In_cps END (* IF *) ELSE (* No exponential averaging *) IF (ABR_Capacity_In_cps <= 0) THEN Load_Factor <-- Infinity ELSE Load_Factor <-- ABR_Input_Rate / ABR_Capacity_In_cps END (* IF *) END (* IF *) Fair_Share <-- ABR_Capacity_In_cps / Number_Active_VCs_In_Last_Interval Max_Alloc_Previous <-- Max_Alloc_Current Max_Alloc_Current <-- Fair_Share FOR ALL VCs DO Seen_VC_In_This_Interval[VC] <-- 0 Seen_BRM_Cell_In_This_Interval[VC] <-- 0 END (* FOR *) ABR_Cell_Count <-- 0 IF (Per_VC_CCR_Option) THEN FOR ALL VCs DO CCR[VC] <-- Number_Of_Cells[VC]/Averaging_Interval Number_Of_Cells[VC] <-- 0 END (* FOR *) END (* IF *) VBR_and_CBR_Cell_Count <-- 0 Restart Averaging_Interval TimerA Forward RM (FRM) cell of ``VC'' is received:IF (NOT(Per_VC_CCR_Option)) THEN CCR[VC] <-- CCR_In_FRM_Cell END (* IF *) A Backward RM (BRM) cell of ``VC'' is received:
IF (Averaging_VCs_Option) THEN IF (Contribution[VC] < 1) THEN (* VC inactive in current interval *) Number_Active_VCs_In_This_Interval <-- Number_Active_VCs_In_This_Interval - Contribution[VC] + 1 IF ((Immediate_Fairshare_Update_Option) AND (Contribution[VC] < Decay_Factor)) THEN Number_Active_VCs_In_Last_Interval <-- Number_Active_VCs_In_Last_Interval - (Contribution[VC] / Decay_Factor) + 1 Fair_Share <-- ABR_Capacity_In_cps / Number_Active_VCs_In_Last_Interval END (* IF (Immediate ...) *) Contribution[VC] <-- 1 END (* IF (Contribution ... ) *) ELSE (* NOT (Averaging_VCs_Option) *) IF (NOT(Seen_VC_In_This_Interval[VC])) THEN Seen_VC_In_This_Interval[VC] <-- 1 END (* IF *) IF ((Immediate_Fair_Share_Option) AND (NOT(Seen_VC_In_Last_Interval[VC]))) THEN Number_Active_VCs_In_Last_Interval <-- Number_Active_VCs_In_Last_Interval + 1 Fair_Share <-- ABR_Capacity_In_cps / Number_Active_VCs_In_Last_Interval Seen_VC_In_Last_Interval[VC] <-- 1 END (* IF ((Immediate ..)) *) END (* IF-THEN-ELSE (Averaging_VCs_Option) *) IF (Seen_BRM_Cell_In_This_Interval[VC]) THEN ER_Calculated <-- Last_Allocated_ER[VC] ELSE VC_Share[VC] <-- CCR[VC] / Load_Factor (* Max-Min Fairness Algorithm *) IF (Load_Factor > 1 + δ) THEN ER_Calculated <-- Max (Fair_Share, VC_Share) ELSE ER_Calculated <-- Max (Fair_Share, VC_Share, Max_Alloc_Previous) END (* IF *) Max_Alloc_Current <-- Max (Max_Alloc_Current, ER_Calculated) (* Avoid Unnecessary Transient Overloads *) IF ((CCR[VC] < Fair_Share) AND (ER_Calculated >= Fair_Share)) THEN ER_Calculated <-- Fair_Share (* Optionally Disable Feedback To This VC For An Averaging Interval *) END (* IF *) ER_Calculated <-- Min(ER_Calculated, ABR_Capacity_In_cps) (* Ensure One Feedback Per Switch Averaging Interval *) Last_Allocated_ER[VC] <-- ER_Calculated Seen_BRM_Cell_In_This_Interval[VC] <-- 1 END (* IF *) (* Give Feedback In BRM Cell *) ER_In_BRM_Cell <-- Min (ER_in_BRM_Cell, ER_Calculated)
At each cell slot time (two-class scheduling):IF (VBR_Credit >= ABR_Credit) THEN IF (VBR Queue is Non-empty) THEN Schedule VBR Cell IF (ABR Queue is Non-empty) THEN VBR_Credit <-- VBR_Credit - 1 END (* IF *) VBR_Credit <-- VBR_Credit + VBR_Fraction ABR_Credit <-- ABR_Credit + ABR_Fraction ELSE IF (ABR Queue is Non-empty) THEN Schedule ABR Cell END (* IF-THEN-ELSE (VBR Queue is Non-empty) *) ELSE (* NOT (VBR_Credit >= ABR_Credit) *) IF (ABR Queue is Non-empty) THEN Schedule ABR Cell IF (VBR Queue is Non-empty) THEN ABR_Credit <-- ABR_Credit - 1 END (* IF *) ABR_Credit <-- ABR_Credit + ABR_Fraction VBR_Credit <-- VBR_Credit + VBR_Fraction ELSE IF (VBR Queue is Non-empty) THEN Schedule VBR Cell END (* IF-THEN-ELSE (ABR Queue is Non-empty) *) END (* IF-THEN-ELSE (VBR_Credit >= ABR_Credit) *)