| Scott Helvick, shelvick@wustl.edu (A project report written under the guidance of Prof. Raj Jain) |
Download |
Among computer enthusiasts and professionals alike, few performance measures are as interesting as those of a system's hardware. Regardless of its intended use, the first thing a power user will do when he is done building a system is to test its hardware performance. The expansive variety of hardware performance analysis tools created by the open source community is proof of this.
This paper will list and discuss the pros, cons, and intended usage of several such tools. It is important to remember that performance tools are run on an operating system (GNU/Linux, in the case of those described in this paper) and may be affected by other processes running on a given system. Thus, there will always be a margin of error in any measurement. The tools in this paper have been chosen with the goal of minimizing this overhead, so it is hoped that their measurements will maintain a high a degree of accuracy.
Not all system components are created equally, and every component has a different impact on the system as a whole, an impact which changes with every workload. For example, a system used only for word processing and web browsing may benefit most from a simple upgrade to system memory. On the other hand, the bottleneck in a high-powered gaming PC is usually the graphics card [Pegoraro04]. Surprisingly enough, not all metrics for measuring system performance are created equally, either. The Linux kernel displays, on boot-up, a metric called BogoMips. BogoMips is a measurement of how fast a certain type of busy loop, calibrated to a machine's processor speed, runs on that machine. Quite literally, it measures "the number of million times per second a processor can do absolutely nothing." Incidentally, "Bogo" comes from the word "bogus," a way of mocking how the calculation is unscientific [Dorst06].
Benchmarking software tools may be classified under three categories -- Quick-hit, Synthetic, and Application benchmarks. Quick-hit benchmarks are simple tests to take a particular measurement or get a reading of a specific aspect of performance. They are not meant to give a holistic perspective of system performance, but may be useful in the cases where only one component needs to be analyzed. In some cases, quick-hit benchmarks can also be useful for identifying damaged hardware. Synthetic benchmarks are usually more extensive tests meant to put a system or a single performance aspect under heavy load. Synthetic benchmarks are useful for measuring the maximum capacity or throughput for a given component. However, they do not represent a "real-world" workload -- that's why Application benchmarks exist. Application benchmarks are intended to test systems with loads similar to what they would experience in a "production" environment [Wright02]. Because application benchmarks attempt to simulate a real-world workload, their performance is often influenced more by the operating system than the performance of synthetic or quick-hit benchmarks. For this reason, the author has determined that they are not as relevant to hardware performance, thus no application benchmarks are discussed in this paper.
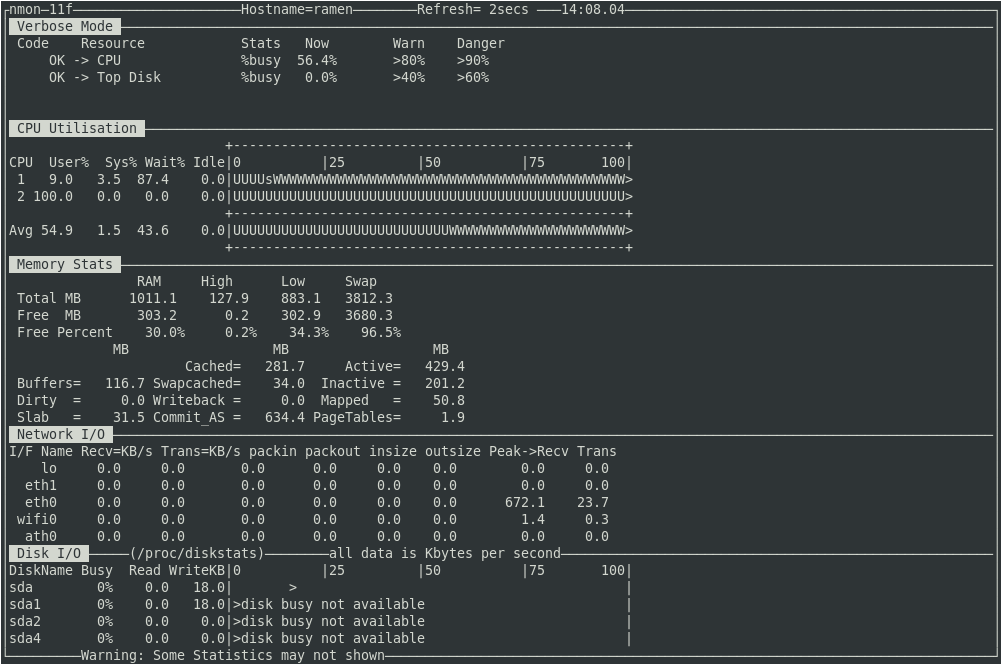
Nmon, short for Nigel's Monitor, is a multi-faceted monitoring tool. Hosted by IBM, nmon was written for AIX, but the author had no trouble running it on GNU/Linux. However, the tool is provided only as a binary file and has not been open sourced; thus, anyone wishing to compile it for themselves or run it on an incompatible operating system may be out of luck. Nmon captures a wide variety of performance data -- network I/O rates, disk I/O rates, memory usage, and others. One of nmon's defining features is its support for exporting, analysing, and graphing its data output. Running nmon with the -f or -F switch will save its output as a .csv file. IBM provides other nmon tools, such as an Excel Analyser, which will make use of this file [Griffiths08]. Figure 2-1 depicts nmon reporting CPU, memory, network, and disk measurements. Because the system is mostly idle, this particular screenshot is only an example of nmon output and does not provide useful data. Nmon may also display information about system build and processors, the system kernel, filesystems, processes, and Network File System shares.
Iostat is a tool used to monitor system I/O by reading files in the /proc filesystem and comparing the time the devices are active to their average transfer rates. It is available as part of the sysstat package, which also includes sar and mpstat. Iostat may generate reports detailing statistics about CPU utilization, device utilization, and/or network filesystems. One of iostat's differentiating features is that it measures both instantaneous, one-time performance as well as performance over time. Figure 2-2 depicts the CPU and device utilization reports. In this example, the CPU is mostly idle with no outstanding disk I/O requests. Also listed in the CPU report are percentages for system- and user-level executions (with and without nice prioritization), I/O waits and waits due to the hypervisor servicing other virtual processors. The device utilization report lists the following fields (in this order): read requests merged per second, write requests merged per second, actual reads per second, actual writes per second, megabytes read per second, megabytes written per second, average request size (in sectors), average queue length, average wait time per request, average service time per request, and percentage of CPU time utilized by I/O [Godard08]. In summary, the system analyzed in Figure 2-2 has a history of long idle times followed by large numbers of write requests (as shown by the high number of queued writes/second compared to queued reads/second).

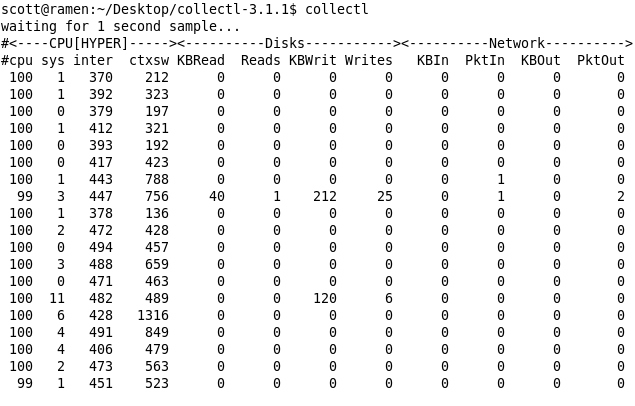
Collectl is a versatile "do-it-all" performance monitoring tool. It includes options to run interactively or as a daemon, options to format its output in various ways, and options which ensure the user sees only the data he wants to see, at the rate at which he wants to see it. Figure 2-3 shows a default run of collectl; with no options specified, it displays terse statistics about CPU, disk, and network performance. (Collectl's complete domain includes CPU interrupts, NFS shares, inodes, the Lustre file system, memory, sockets, TCP, and Infiniband statistics.) Each line in the example represents one second of sampling. The CPU measurements are, in order: CPU utilization, time executing in system mode, interrupts per second, and context switches per second. The disk and network sections display kilobytes read and written (and total reads/writes), and kilobytes in/out (and packets in/out), respectively. The example system is mostly idle, with the exception of a single-threaded process, in user space, using one CPU. (This particular system has two processor cores, so it may have allowed collectl alone to monopolize an entire core.)
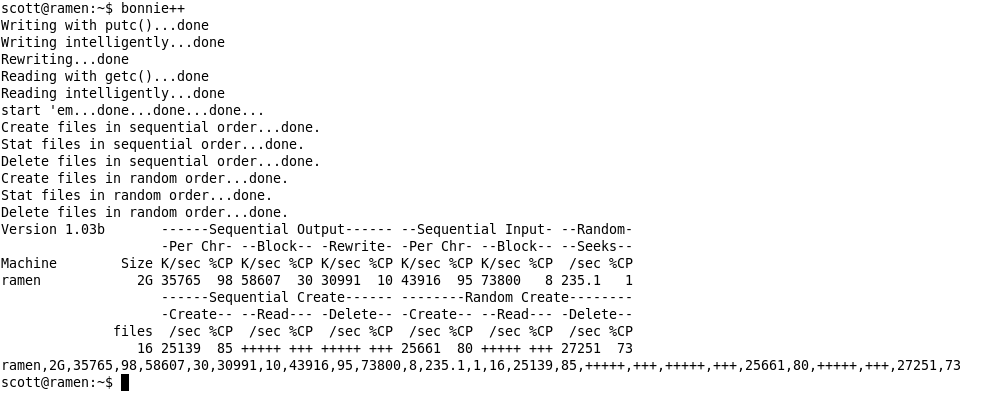
Bonnie++ is a benchmark written in C++ for the purpose of testing hard drive and filesystem performance. Its predecessor, bonnie, was written in C and included a series of I/O tests meant to simulate various types of database applications. Bonnie++ tests in two sequences. The first is bonnie's original series of database I/O operations, while the second sequence tests the reading and writing of many small files. Twelve tests are performed in total, including three types of sequential output, two types of sequential input, and random seeks. Sequential access is simply reading/writing disk blocks in sequential order. In practice, most disk accesses are not sequential, the exceptions being large files or formatting operations. However, testing sequential access can be a great synthetic benchmark, because the disk head moves very little, resulting in high transfer speeds. Random access, of course, involves reading/writing in random locations on the disk. This is slower than sequential access, since the disk head is required to move rapidly, although it is closer to a real-world simulation [LinuxInsight07]. The results of running bonnie++ with no parameters are shown in Figure 2-4. Two gigabytes were written (in three different ways) and the speeds and CPU utilizations were measured. Then they were read, sequentially and randomly, again measuring the speed (in kilobytes and random seeks per second) and CPU utilization. Finally, 16*1024 files were created and deleted, randomly and sequentially. The +'s signify a test that could not be accurately measured because it ran in less than 500 ms [Coker01].
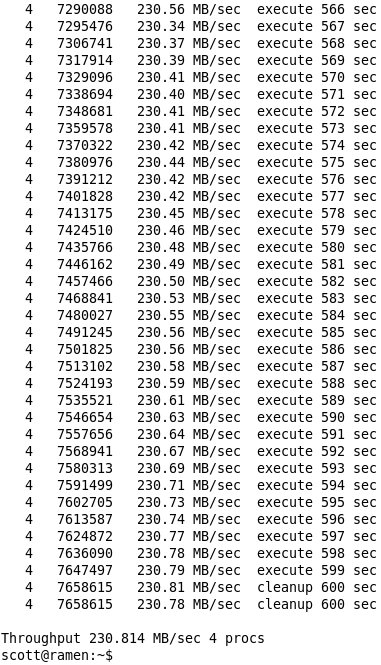
Dbench is a synthetic benchmark which attempts to measure disk throughput by simulating a run of Netbench, the industry-standard benchmark for Windows file servers. To do this, dbench parses a text file containing a network sniffer dump of an actual Netbench run. In this way, dbench "fakes" a Netbench session and produces a load of about 90,000 operations. Figure 2-5 shows the tail end of a ten-minute dbench run. In this particular run, four client processes were simulated; the total mean throughput was 230.814 MB/sec. The figure does not show a complete run, but dbench actually goes through three phases -- warmup (a lighter load which allows disk throughput to slowly increase), execute (the most strenuous part of the benchmark), and cleanup (when any created files are deleted). Though a comprehensive benchmark, dbench is limited in its versatility -- only seven options may be passed to it via the command line, and two of those are specific to tbench, which is a client-server version packaged with dbench [Tridgell02].
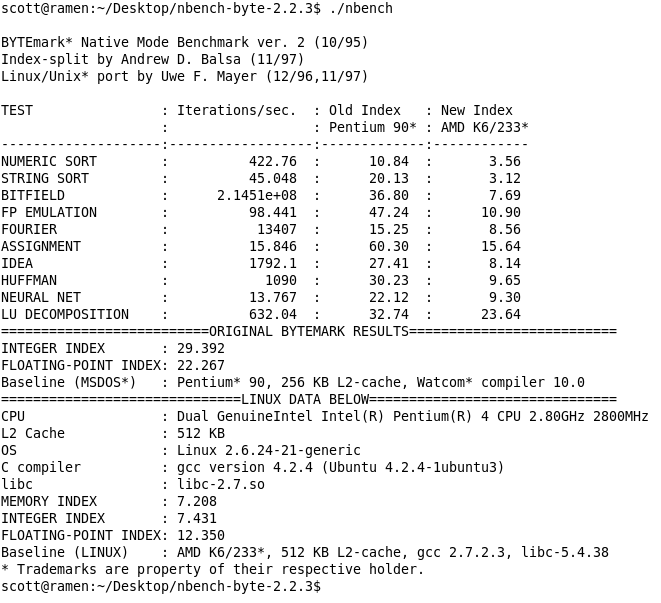
Nbench is based off of BYTE Magazine's BYTEmark benchmark program; the original BYTE benchmarks were modified to work better on 64-bit machines. Nbench is a synthetic benchmark intended to test a system's CPU, FPU, and memory system. Nbench runs ten single-threaded tests, including integer and string sorting, Fourier coefficients, and Huffman compression. A number of options are available, but their accessibility is limted by the requirement of a command file, decreasing the tool's usability. Something especially interesting, and perhaps unique, about nbench is that it statistically analyzes its own results for confidence and increases the number of runs if necessary. Practically, this means that the benchmarks may be run even on a heavily-loaded system (whether or not that's a good idea) and still produce accurate results -- the greater variance just means it will take longer to get there. Figure 2-6 illustrates a default run of nbench; the unit of measure is iterations/second, so these metrics are HB. The measurements of the system under test are compared to those of a Pentium 90 and an AMD K6/233 [Mayer03]. The example system, a dual-core Pentium 4 (2.8 GHz), trounces the baseline systems except, strangely, in the Assignment and Neural Net benchmarks. (Further investigation is beyond the scope of this paper, but this author speculates that the Pentium 4 may have a design flaw which inhibits its performance on specific tasks.) The index scores at the end denote, on average, how many times faster the target system ran the benchmarks compared to the baseline systems. In this example, the P4 particularly excelled at the floating-point benchmarks -- Fourier, Neural Net, and LU Decomposition.
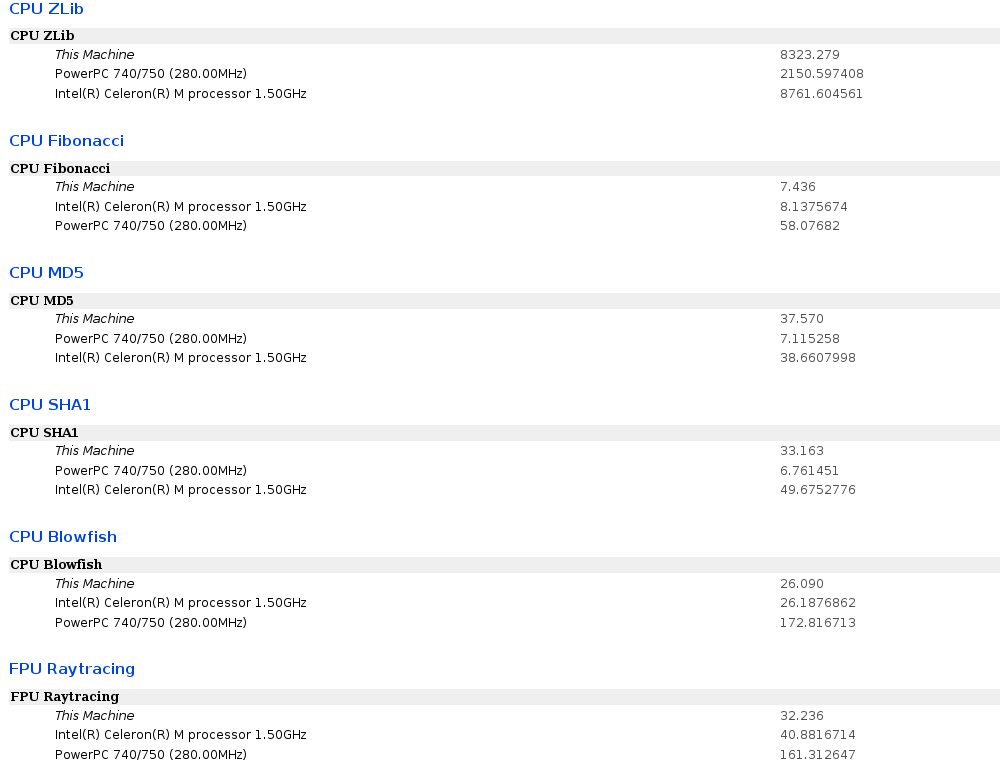
Hardinfo, a rare GUI-only performance analysis tool, is both a quick-hit and synthetic benchmark. Figure 2-7 shows a report generated by hardinfo after running its six benchmark routines; the Zlib, MD5 and SHA1 CPU tests are HB metrics, while the CPU's Fibonacci and Blowfish computations as well as the FPU Raytracing measurement are LB metrics. With the exception of the SHA1 benchmark, the example machine's performance is on par with that of the Celeron processor. The hardinfo GUI itself also displays a host of information about a system's hardware specifications; it does this by parsing several files in the /proc directory [Pereira03]. Hardinfo is packaged with the Ubuntu Linux distribution and commonly included with the GNOME desktop. Unfortunately, hardinfo only contains a GUI interface and its output may not be directed to the command line.
With as quickly as the technology sector is growing, performance analysis -- particularly of hardware -- is sure to continue to be popular among computer enthusiasts and professionals alike. It is this author's hope that some of the open source tools developed in the late 1990's will be updated and enhanced to perform well with upcoming system architectures.
This paper has listed and discussed several hardware performance analysis tools; in particular, synthetic and quick-hit benchmarks created by the open source community. Figure 3-1 summarizes the discussion of these utilities: nmon, iostat, collectl, bonnie++, dbench, nbench, and hardinfo. While no tool running in software can perfectly measure the performance of hardware, the tools in this paper have been chosen to minimize this problem. In conclusion, this survey of hardware performance analysis tools is significant, but far from comprehensive.
| Tool Summary | ||||
|---|---|---|---|---|
| Name | Type | Uses | Pros | Cons |
| nmon | Quick-hit | Monitor CPU/memory/disk/network interactively in real-time | Interactive, easy-to-use, versatile | Closed-source, binaries only |
| iostat | Quick-hit | Monitor instantaneous system I/O, compare to historical I/O | Powerful and versatile, monitors historical and real-time performance | Generally only available as part of the sysstat package |
| collectl | Quick-hit | Collect large numbers of system performance stats for processing by another application | Offers an extremely wide variety of measurements | Large number of options may scare away novice users |
| bonnie++ | Synthetic | Test hard drive and filesystem performance with simulated real-life benchmarks | Runs a wide array of tests, fairly realistic | Not all tests are useful on an extremely fast machine or with very limited disk space |
| dbench | Synthetic | Measure disk throughput, simulate Netbench on Linux | Accurate and powerful, free version of a well-known benchmark | Options are limited |
| nbench | Synthetic | Measure CPU/FPU/memory performance via several methods | Wide array of well-known benchmarks, highly robust and accurate | Difficult to use, most options require a command file |
| hardinfo | Synthetic | Quickly gather information about a system and its performance | Easy to use, quick one-click benchmarks | GUI only |
| Acronym | Meaning |
|---|---|
| CPU | Central Processing Unit |
| FPU | Floating Point Unit |
| GUI | Graphical User Interface |
| HB | Higher is Better |
| I/O | Input/Output |
| LB | Lower is Better |
| NFS | Network File System |