| Jason Barnes, jason.barnes@wustl.edu (A paper written under the guidance of Prof. Raj Jain) |
Download |
Keywords: Operating System Detection, Operating System Fingerprinting, p0f, nmap, k-p0f, Network Security
Network administrators need to be able to determine the OS of every machine running on their networks to protect against critical security vulnerabilities. Operating System Detection (OSD) tools are designed to scan a network and identify each machine's OS. In order construct a complete image of the entire network, an OSD tool must be able to scan a large network quickly enough to identify users that may only connect for a brief time. For this reason, a good OSD tool must satisfy two requirements: It must be accurate and fast.
Currently, there is not a good method to determine the OS of all machines, including transient connections, on a network. In an average setting where the administrators cannot access every machine on the network, the only ways to catalog the OS of every machine is to either check all of the systems by hand or use an OSD tool. In networks with statically addressed machines, keeping an up-to-date list would be a possible but time-consuming activity. In the average case where there are machines that are assigned IP addresses dynamically, a slowly compiled list could miss machines that are only connected temporarily.
Knowing the OS of every machine in a network, including those that do not have static addresses, is a vital piece of information that can help network administrators prevent security incidents. For example, if a critical security exploit was found for Windows XP, then a network administrator could preemptively update any affected machines to avoid an incident. This is why it is important for an OSD tool to be fast enough to catch temporarily connected machines: Any missed machines could become a security risk.
Tools already exist that can accurately perform OSD, but these tools are not designed to give a real-time listing of every OS in a large network. Two of the most commonly used OSD tools are the network mapper (nmap) and the passive OS fingerprinter (p0f) [Gagnon12]. Nmap works by actively sending packets to a range of hosts and identifying them by their responses. P0f works by passively observing all network traffic and classifying the OS used on each side of every TCP connection. Most other OSD tools are based on nmap or p0f, so we focus on those two.
Nmap is one of the most popular and accurate tools for mapping a network and performing OSD [Greenwald07][Lyon09]. It works by sending specially crafted packets to a target machine and then deduces its OS based on the response. Nmap is known to be an accurate OSD tool, and it has the ability to differentiate between minor OS releases [Greenwald07]. Using it to scan an entire network will normally yield an accurate result for each machine on the network that responds to the nmap probes, but the scanning process can take a long time to complete for a large network. The additional traffic generated by nmap or any other active scanner also uses up bandwidth that would otherwise be consumed by regular network users, so frequent scans can be inconvenient.
Although nmap is accurate, there are several cases where nmap cannot detect a machine's OS. Nmap needs at least one open and one closed port to perform OSD accurately. In the case where a machine on the network does not accept incoming connections, nmap will not be able to determine the machine's OS. Network Address Translation (NAT) devices also prevent nmap from working correctly. If there is no way to address a machine behind a NAT device, then nmap cannot scan the device. The active nature of nmap also means that firewalls and IDS can detect the packets that nmap sends and block it from working. There is active research in making active scans like those performed by nmap stealthier, but since nmap is an active scanner, it must send and receive packets in order to work [Greenwald07].
Passive OSD solves many of the problems associated with active scanning tools. The biggest advantage of passive OSD is that it can work in cases where active scanners such as nmap fail. Since passive observation does not generate any new traffic, it cannot be blocked by firewalls, closed ports, or NAT devices. The scope for a passive scanner is all of the traffic that is observable; it does not have to rely on responses to specially crafted packets.
p0f is a passive OSD tool that can also determine hypertext transfer protocol (HTTP) clients, physical link types, and whether a machine is behind a NAT device [Zalewski12]. Its OSD mechanism works by observing all of the transmission control protocol (TCP) handshakes on a network. As long as a machine makes a TCP connection while p0f is running, it can attempt to identify the machine's OS. Like all passive scanners, p0f can read traffic that was sent behind NAT devices or firewalls, but it can only use TCP traffic. In the case that a machine communicates without using TCP or where transport layer traffic is encrypted, p0f will not work.
As an example, a group of 10 personal computers using a wireless router would be entirely undetectable to an nmap scan. Since the router does not forward ports, an nmap OSD scan of the IP address would only return a result for the router. However, p0f could detect the OS of all 10 computers as long as each one is sending traffic while the scanner is running. Even if the machines are running advanced antivirus and firewall software, a passive scanner will not be impeded. p0f also covers the case of machines that are only temporarily connected to the network. As long as p0f can keep up with the bandwidth that it observes, it can attempt to detect the OS of every machine communicating on the network.
p0f is able to determine the OS of a remote machine because of implementation differences in how each OS constructs TCP synchronize (SYN) or synchronize and acknowledge (SYN+ACK) packets. Although the format of the header fields is standardized, the values within the fields and are not fixed. The TCP options are particularly variable, since they can appear in any order. In total, p0f extracts 9 values from each SYN or SYN+ACK packet: The IP version, the initial time to live, the length of the IP options, the max segment size, the window size, the window scaling factor, the ordering of the TCP options, a set of implementation quirks, and whether there is TCP payload data. These nine values differ enough between each OS to determine which OS sent them. The corresponding values for each known OS are stored in p0f's signature list.
Xprobe is an active OSD tool that works in a similar way to nmap [Gagnon12][Yarochkin09]. It works by sending packets to a range of remote hosts and observing their responses, but unlike nmap, it can also query applications running on the remote hosts for additional information. Xprobe also introduced fuzzy OSD, a feature that was later incorporated by nmap [Greenwald07][Yarochkin09]. As an active scanner, Xprobe shares the same weaknesses that nmap has with being unable to scan devices behind NAT devices.
Most of the other tools for passive OSD are either derivatives of p0f or use similar techniques. Ettercap is a tool for performing man in the middle attacks, but it also has OSD capabilities that are based on p0f [Zalewski04]. Similarly, the netfilter kernel module OSF is based on p0f, but it has the added benefit of operating in the Linux kernel and being easily inserted and managed according to iptables rules [ioremap]. Deviating from p0f, Satori is a closed-source tool that passively analyzes dynamic host configuration protocol packets to perform OSD [Kollman10]. All of these tools rely on a list of signatures that are generated by manually analyzing values extracted from packet headers and matching them to the correct OS.
Hosd is a hybrid OSD tool that combines passive and active scanning [Gagnon12]. This tool is designed to perform both passive and active OSD and mixes the results from both to determine the OS of an IP address. After it collects data from both kinds of scans, it uses diagnosis theory to achieve higher accuracy than both nmap and p0f. However, because hosd must rely on external programs to generate packet traces, it requires collecting traces of every packet across a time period before analysis can be done.
Previous work has also been done using naïve Bayesian classifiers to perform passive OSD [Beverly04]. This kind of tool attempts to find statistical correlations between the observed traffic and the associated OS. The classifier seen in [Beverly04] is trained in two ways: Using p0f's signature list and by using accurately labeled Internet traffic. The classifier produces results with fewer unknown signatures, but it is unsuitable for application in a large network. Since it does not produce any ‘unknown' signatures, a network administrator has no indication that there are possibly new or unknown OS active within the network.
Nmap has been proven to be accurate by previous work [Gagnon12], but to our knowledge, no study has been done on its speed in scanning a network. We performed an experiment to evaluate how quickly nmap can complete a scan of a network. There are many factors that could be varied to show nmap's performance under all conditions. We chose to find nmap's performance in the best case since we suspected that, even in the best case, nmap would not be fast enough to scan a network in real-time. We conclude this section by presenting our results and discussing their meaning.
Although we could vary many factors to show nmap's performance under various conditions, we have chosen to test nmap to show its best case performance. If nmap cannot quickly scan a network in the best case, then any worse cases will also be inadequate. Table 1 lists the important parameters.

The most important factor in how long nmap takes to scan a network is the number of target hosts. 10,000 hosts will clearly take longer to scan than 10 hosts. Traffic congestion and the number of hops between the scanner and the target can both increase the communication delay between the scanner and the target, leading to longer scan times.
The main system parameter on the target host that can impact nmap are its open and closed ports. Nmap's OSD mechanism needs one open and one closed port on the target host to function correctly. If only high numbered ports are open or closed, then nmap has to scan a larger number of ports than if two lower numbered ports are open and closed.
The configuration of the scanning machine can also impact the scan completion time. If the scanner is under considerable system load or has an out-of-date version of nmap, the scan could take longer to complete. The hardware configuration of the scanning host could also impact the time that nmap takes to finish, but in our experimental setup, the hardware configurations were fixed.
We designed an experiment to study nmap's speed at completing scans in a laboratory setting. The experiment was performed entirely within the Open Network Laboratory (ONL) [Wiseman08]. ONL allows us to generate a network topology made up of physical machines that can communicate at gigabit speeds. For all of the laboratory tests, we used the ONL topology seen in Figure 1. All 20 hosts in this topology are PC8cores communicating on a 10 gigabits per second network. The host labeled "scanner" was installed with nmap version 5.21.

The experiment has been designed as a one factor experiment with multiple levels. The factor to be varied is the number of target hosts: All other parameters are fixed for the experiment. There is no congestion on the network, one hop between the scanner and each target, and each host has port 21 closed and port 22 open. All hosts, including the scanner and the targets, are using the Linux 3.2.0.37 kernel.
The level for the number of target hosts is varied from 1 to 19 hosts. For each level, the experiment is replicated 10 times. The nmap command used for each scan is "nmap -O 192.168.1.2-X", where X is the address of the target host with the highest IP address. The –O option is used to turn on nmap's OSD functionality.
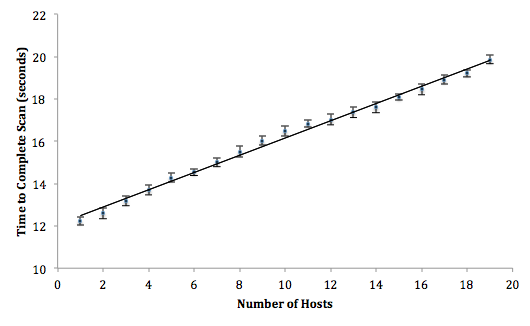
Figure 2 shows the results from the experiment. The error bars indicate 95% confidence intervals for each mean observation. With only 19 target hosts, nmap takes about 21 seconds to complete. Since we only had 20 machines at our disposal, we used a simple linear regression model to predict how fast nmap would perform with 10000 target hosts. Table 2 shows the parameters from our model, both of which are significant. At a confidence of 95%, nmap will take between 4171.45 and 4174.18 seconds (roughly 69 minutes) to complete with 10000 targets.

Temporary Internet users are likely to be skipped by an nmap scan of a large network. A user that only connects to the network for a few minutes to check email or browse the Internet could be missed if an entire scan of the network takes over an hour complete. The model shows that nmap is well suited for performing occasional scans of machines that are always connected to a large network. While an OSD from nmap may take too long to catch temporary users, it is fast enough to be used to accurately catalog the OS of statically addressed machines.
Even if a passive OSD tool could detect every OS on a network in real-time, nmap is still a useful and necessary tool to use for OSD. Passive tools rely on traffic sent by machines to perform OSD. Since nmap can actively scan hosts regardless of their activity, it can detect some hosts that passive systems cannot. For example, a passive tool would not detect a NAT device that does not send traffic, but nmap will be able to detect it. However, since nmap and other active tools cannot scan behind such devices, passive tools are necessary to get a complete image of every OS on a network.
Although p0f is an accurate OSD tool, it was designed to work on a small number of connections, not on a large network. We have created a tool based on p0f called kernel p0f (k-p0f) that is designed to perform OSD on every connection it sees on a gigabit network. The main speedup over p0f comes from k-p0f not including the any of p0f's unrelated features, such as HTTP client detection and physical link type detection. We also use a logging scheme that reduces the time wasted on redundant entries. The rest of the speedup comes from operating within the Passive Network Appliance (PNA) and a few design changes that resulted from working within kernel space.
k-p0f is split into three parts: A real-time monitor for the Passive Network Appliance that performs OSD, a log generator and database that stores the results, and a web application that gives network administrators an easy way to view results and identify unknown results. Since the unknown print identification tool is run offline and has no impact on k-p0f's throughput, it is not covered in this paper.
We implemented k-p0f as a real-time monitor for the PNA. As a real-time monitor for the PNA, k-p0f does not have to make any system calls to intercept packets from the OS's network stack. Instead, the PNA directly provides the k-p0f monitor with each packet as they are processed through the PNA. Because p0f has to make system calls to observe traffic, it has to deal with too much overhead to keep up with a large amount of traffic [Braun10]. We could have seen similar benefits if we had directly coded k-p0f as a kernel module, but since the PNA is directly suited to performing real-time passive network analysis, we chose to use it instead.
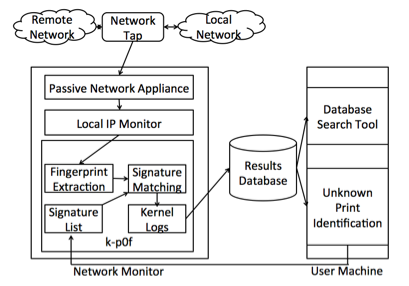
Figure 3 shows the flow of data from the network to the end user interface and the placement of k-p0f within the PNA. All traffic seen on the network is mirrored at the network tap while the PNA is running on a machine dedicated to network monitoring. Once the PNA has finished accounting for the packet, it passes it to each of the real-time monitors in serial. In this example, the PNA first sends the packet to the Local IP Monitor, an included monitor that tracks local IP addresses. When the first monitor is finished, it sends the packet to k-p0f, and when k-p0f is finished, the PNA moves on to the next packet.
When k-p0f gets the packet, it ignores it unless it is TCP and has the SYN flag set. k-p0f then extracts all of the necessary values from the packet to create a fingerprint, and then it attempts to match those values to an OS by using a list of known signatures. The results are first stored temporarily in its kernel-space log, but a user-space program periodically moves this information to a results database. Once the logs have been stored, a network administrator can search the results or use the unknown print identification tool to discover add new signatures to the signature list used by the k-p0f monitor.
We chose to modify p0f's OS detection algorithm to use inside k-p0f. Since most of the existing tools are modifications of earlier versions of p0f, we designed k-p0f to use the methods found within the most recent version of p0f, version 3. k-p0f is able to directly use the newest format of p0f signature list, so it can immediately benefit from the well maintained list. Although it is accurate and has a large signature list, we could not adapt the methods in nmap for k-p0f since nmap relies on seeing responses to specially crafted packets and does not fit into a passive approach.
k-p0f uses nearly the same fingerprint extraction methods that p0f uses. We extract all of the same values that p0f uses except for the IP version and the quirks related to IPv6 since most traffic is still IPv4. Every other field is calculated using the exact method used by p0f with the exception of the option list. While p0f stores both the exact ordering of the options and its hash, we only store the hash. This approach saves space, but it also makes adding new signatures into the list more difficult, since the actual option ordering for an unknown signature would have to be discovered by either matching the hash to an existing option ordering or using p0f to determine the ordering. To mitigate this problem, if the option hash matches a known ordering, we retroactively reconstruct the ordering as part of our unknown print identification tool.
While p0f is designed to fingerprint every TCP connection that it sees, k-p0f attempts to fingerprint every TCP/IP packet with the SYN flag set. This change means that k-p0f does not have to keep track of the state of any connection. Since the information in each SYN packet is independent of all other packets for the purpose of OS detection, we can safely ignore whether a connection was set up appropriately. Similarly, we do not attempt to filter out duplicate packets since they cannot impact the accuracy of the results.
Each time that a fingerprint is extracted, it must be matched against every specific and generic signature in the p0f fingerprint list. Specific signatures contain fewer wildcards than general signatures, and the extracted fingerprint only matches to a specific signature if every field is the same. If no specific match is found, then the generic signature with the fewest wildcards is selected. Since there are less than 200 entries in the list, sequentially checking the entire list is fast. To account for differences in time to live and the most common IP quirks, p0f includes a "fuzzy-matching" capability that attempts to match unknowns to the list while loosening the requirement of having to match those fields. We did not implement this into our matching algorithm, but the same result can be achieved by adding generic signatures to the list that have wildcards for the time to live and quirks.
In addition to speeding up the per-packet processing, we also achieve higher performance by reducing the total workload. Instead of fingerprinting every SYN or SYN+ACK packet seen by k-p0f, we limit the number of packets we analyze by only tracking a user-defined number of matches per IP address. Since many IP ad-dresses are likely going to have redundant entries within each logging period, this method limits the total amount of repeat information. This decreases the work k-p0f has to perform by dropping any packets that exceed the limit. This is also a useful mechanism for machines with limited memory since the number of results per IP can be lowered to save space.
k-p0f stores the OS fingerprinting results using the same hash table format used by the PNA [Schultz11]. The hash table is keyed by the source IP addresses of SYN and SYN+ACK packets. Each entry in the table is made up of a header and enough space to hold the maximum number of logs for a single IP address. The header contains the source IP address and counts how many fingerprints are currently stored. If the log entry is full, then new SYN or SYN+ACK packets with that IP address will be ignored by k-p0f. Like the PNA, k-p0f uses two hash tables to allow us to both write logs to disk and store new logs simultaneously.
Userspace programs handle setting up k-p0f and writing the logs to disk. When k-p0f is started, the user can specify the number of IPs to record, the number of logs to store per IP and the interval to dump the k-p0f logs to disk. Once the initial setup and memory allocation is complete, the userspace logging program will write the k-p0f logs to disk at the interval specified by the user. The stored logs are sent to a webserver every 5 minutes where they can be accessed and searched by a simple web application.
Since a passive OSD tool must be able to detect the OS of every connection that passes through a network, we tested p0f and k-p0f's capacity to perform detection on a gigabit network. Both tools operate as an M/M/1/B queue where B is the number of packets that can be held in the network interface's buffer. Here, we make the assumption that packet inter-arrival times have a Poisson distribution to simplify analysis [Paxson95]. If the service rate μ is less than the arrival rate λ, then the tool will drop packets, increasing the chance of missing a connection.
We evaluated p0f and k-p0f in two settings: In a laboratory with constructed traffic and in an operational setting with real-world traffic. The laboratory experiments were performed to determine the maximum sustainable throughput of both tools. The real-world deployment illustrates that k-p0f can perform in an enterprise setting.
To find the maximum sustainable throughput of both p0f and k-p0f, we chose factors that would show the worst-case performance of both tools. Multiple factors can have an impact on the performance of both tools. Table 3 lists the factors that have the most impact on both tools' performance:

The two most important factors for both tools are the incoming packet rate and the percentage of packets with the SYN flag set. If there are fewer packets or only a small number with the SYN flag set, then the tools can achieve a higher throughput. We are interested in the worst-case performance of the tools, so we completely saturate the network with minimum length SYN and SYN+ACK packets. Since we only had access to one signature list, we use the default p0f signature list.
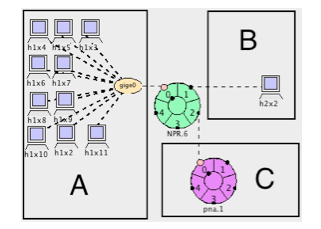
In both the laboratory and real-world deployments, we used the same hardware configuration for the machine running p0f and k-p0f. We used a Dell PowerEdge R410 with two quad-core Intel Xeon L5520 ("Nehalem," no Hyper-Threading) processors operating at 2.27 GHz with 12 GB DDR3 (1066 MHz) system RAM, and a 160 GB 7200 RPM hard drive for storing log files. For the laboratory experiments, we used the ONL topology seen in Figure 4. Subnet A consists of 10 PC1core hosts that send traffic to the single PC1core recipient inside of subnet B. The machine in subnet C is the machine described above that runs p0f and the PNA with the k-p0f monitor, and it receives a mirror of all traffic that is sent through the router. The router is one half of an ONL IXPCluster that uses an auxiliary filter to mirror all traffic received at the subnet A port to subnet B.

The experiment has been designed as a two-factor experiment with three levels per factor. We replicated all experiments 10 times. The factors and levels are listed in Table 4. In addition to p0f and k-p0f, we also tested the PNA since k-p0f runs as a module inside of it. For all levels, we fully saturated the network with minimum size TCP SYN and SYN+ACK packets. The three traffic mixture levels correspond to artificially generated packet traces that represent different remote host OS.
We synthetically generated the traffic to make three different mixtures of packets from the p0f signature list: All Linux 3.x, uniformly randomly distributed, and all unknown. The Linux 3.x and unknown workloads were chosen to test the best and worst cases for k-p0f's matching algorithm. Linux 3.x is the first entry in the list, so k-p0f can make a correct match without checking the rest of the list, but a packet with an unknown signature has to be checked against every signature in the list first. We also chose the uniformly distributed packet mixture to both test k-p0f under an average workload and check the correctness of its matches against p0f's matches. We generated these traffic patterns offline and captured them using tcpdump, and we replayed them during the experiment using tcpreplay.
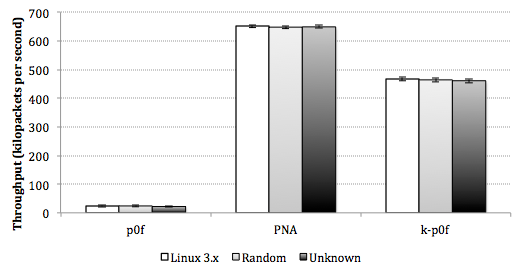
Figure 5 shows the results from the laboratory experiments. The error bars in the figure indicate a 95% confidence interval. We measured the average maximum sustainable throughput across 30-second intervals 10 times for each mixture of traffic and type of monitor. p0f had an average maximum throughput of 24 kilopackets per second (kpps) while k-p0f was able to maintain 464 kpps. The PNA is included in this chart to show its baseline performance with its two default monitors running, and its throughput was 649 kpps. Table 5 shows an ANOVA on the data collected from the experiments. Because of the extreme difference between the p0f and k-p0f results, we applied a log transformation to the data. F-tests show that, contrary to our original hypothesis, the remote host OS does not have a significant impact on the tools' maximum sustainable throughput. This is likely due to there only being 198 SYN and SYN+ACK signatures in the default p0f signature list: If there were more signatures to check against, then the results may be different.
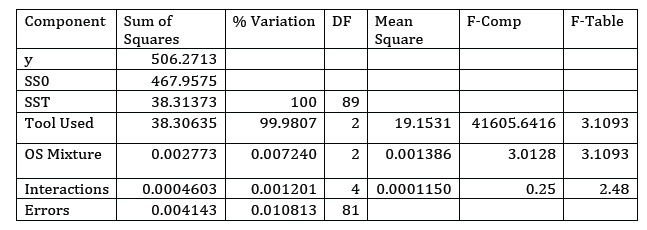
These results demonstrate that k-p0f can sustain a throughput that is 16x greater then the regular implementation of p0f. However, in this experiment, k-p0f reduces the entire PNA tool's throughput by 38%. At first glance, this kind of slowdown would be unacceptable in a tool designed to handle the traffic on a gigabit link, but the traffic seen in this experiment is entirely made up of SYN and SYN+ACK packets and is designed to represent the worst-case scenario. In a more realistic scenario, most of the Internet traffic is not made up of TCP handshakes, so k-p0f should have a negligible impact on the performance of the PNA.
To ensure that k-p0f performs both quickly and accurately in a real-world scenario, we deployed a machine with the PNA and k-p0f monitor to measure its performance. We used a machine with the same configuration as the laboratory experiments, but instead of measuring synthetic traffic, the machine observed traffic that was mirrored from a campus edge node. Servers and regular users on campus generated the traffic. We allowed the tool to run for one day while recording its output and maintaining its web server interface. As in the laboratory tests, we set the logging period to every 10 seconds, and we copied the logs to the webserver every minute.
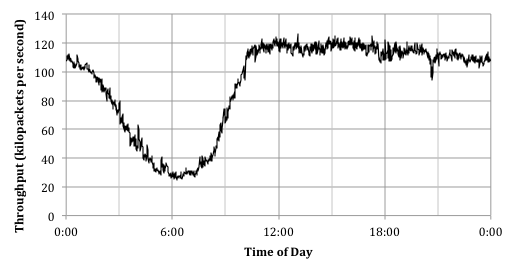
Figure 6 shows the results from our deployment of the PNA and k-p0f for one day of traffic. The chart shows the packet-processing throughput of the PNA at 1-minute intervals. During the busiest parts of the day, the link is fully utilized. Our observed throughput across an entire day matches the results seen in [Schultz11], where the PNA was deployed with only its two default real-time monitors. We found that about 1% of the traffic was being dropped at the network card during periods of heavy load. These results indicate that k-p0f does not have a noticeable impact on the performance of the PNA, and that it can reliably fingerprint most of the traffic seen on a gigabit link.
The reason that k-p0f does not significantly impact the tool's overall through-put is that on average, only about 9% of the total traffic that we observed were SYN or SYN+ACK packets. Across the entire period, the maximum observed rate of these packets was 14314 packets per second. This rate is only 60% of the maximum sustained throughput of p0f that we observed in the laboratory experiments. However, while k-p0f only performs calculations on SYN and SYN+ACK packets, p0f also has to check HTTP packets, which enlarges its measuring scope to a large fraction of the TCP/IP traffic.
This paper has presented our k-p0f passive OSD monitor for the PNA. We have compared the performance of nmap, p0f, and k-p0f and found that both nmap and p0f do not have the capability to detect every OS in a large network in real-time. Through our experiments and our real-world deployment, we have shown that k-p0f is a viable tool for OSD on a gigabit bandwidth network using commodity hardware.
Although it is an accurate tool, nmap is not capable of detecting the OS of machines that are temporarily connected to the network. Since it takes a long time to scan a large network with nmap, a temporary user could connect and disconnect before the scan completes. Furthermore, nmap cannot detect users behind NAT devices, limiting its total detection scope. Despite the nmap's relatively slow scanning speed, nmap has the ability of detecting machines that do not send traffic. Even with a fully functional k-p0f deployment detecting the OS of most connections, occasional nmap scans can be used to find the OS of machines such as NAT devices that do not normally communicate across the network.
Overall, p0f is a capable OS detection tool that can give an accurate overview of the OS operating on a connection. p0f does not offer the same level of specificity as nmap, but it does work in cases where nmap is known not to, primarily behind NAT and firewalls. The core detection algorithm inside of p0f offers a level of accuracy that gives network administrators enough information to track down vulnerable machines and update them to defend against exploits. Since it has a much higher maximum throughput, k-p0f solves our original problem of giving network administrators a tool to catalog the OS of every machine on their networks.
Listed in order of importance:
[Zalewski12] Zalewski, M. "p0f v3 README", 2012. http://lcamtuf.coredump.cx/p0f3/README
[Lyon09] Lyon, Gordon Fyodor. "Nmap Network Scanning: The Official Nmap Project Guide To Network Discovery And Security Scanning Author: Gordon Fyodor L." (2009): 468. http://nmap.org/book/toc.html
[Gagnon12] Gagnon, F., & Esfandiari, B. (2012, April). A hybrid approach to operating system discovery based on diagnosis theory. In Network Operations and Management Symposium (NOMS), 2012 IEEE (pp. 860-865). IEEE. http://www.sce.carleton.ca/~fgagnon/Publications/fgagnonPhDProposal.pdf
[Zalewski04] Zalewski, M. "p0f v2 README", 2004. http://www.stearns.org/p0f/README
[Schultz11] Schultz, Michael J., Ben Wun, and Patrick Crowley. "A Passive Network Appliance for Real-Time Network Monitoring." Architectures for Networking and Communications Systems (ANCS), 2011 Seventh ACM/IEEE Symposium on. IEEE, 2011. http://ieeexplore.ieee.org/document/6062742/
[Beverly04] Beverly, R. (2004). A robust classifier for passive TCP/IP fingerprinting.Passive and Active Network Measurement, 158-167.http://www.cl.cam.ac.uk/research/srg/netos/pam2004/papers/260.pdf
[Braun10] Braun, L., Didebulidze, A., Kammenhuber, N., & Carle, G. (2010, November). Comparing and improving current packet capturing solutions based on commodity hardware. In Proceedings of the 10th annual conference on Internet measurement (pp. 206-217). ACM. http://conferences.sigcomm.org/imc/2010/papers/p206.pdf
[Greenwald07] Greenwald, L. G., & Thomas, T. J. (2007, August). Toward undetected operating system fingerprinting. In Proc. USENIX workshop on Offensive Technologies.http://static.usenix.org/event/woot07/tech/full_papers/greenwald/greenwald.pdf
[ioremap] ioremap OSF. http://www.ioremap.net/projects/osf/
[Kollman10] Kollmann, E. "Chatter on the Wire: A look at DHCPv6 traffic" (2010, November) http://chatteronthewire.org/download/chatter-dhcpv6.pdf
[Wiseman08] Wiseman, C., Turner, J., Becchi, M., Crowley, P., DeHart, J., Haitjema, M., ... & Zar, D. (2008, November). A remotely accessible network processor-based router for network experimentation. In Proceedings of the 4th ACM/IEEE Symposium on Architectures for Networking and Communications Systems(pp. 20-29). ACM. https://onl.wustl.edu/public/Ancs08.pdf
[Yarochkin09] Yarochkin, F. V., Arkin, O., Kydyraliev, M., Dai, S. Y., Huang, Y., & Kuo, S. Y. (2009, June). Xprobe2++: Low volume remote network information gathering tool. In Dependable Systems & Networks, 2009. DSN'09. IEEE/IFIP International Conference on (pp. 205-210). IEEE. http://bandwidthco.com/whitepapers/netforensics/icmp/XProbe2%2B%2B.pdf
[Paxson95] Paxson, V., & Floyd, S. (1995). Wide area traffic: the failure of Poisson modeling. IEEE/ACM Transactions on Networking (ToN), 3(3), 226-244. http://www.cl.cam.ac.uk/teaching/0809/DigiCommI/paxson1995widearea.pdf